Fig. D.1
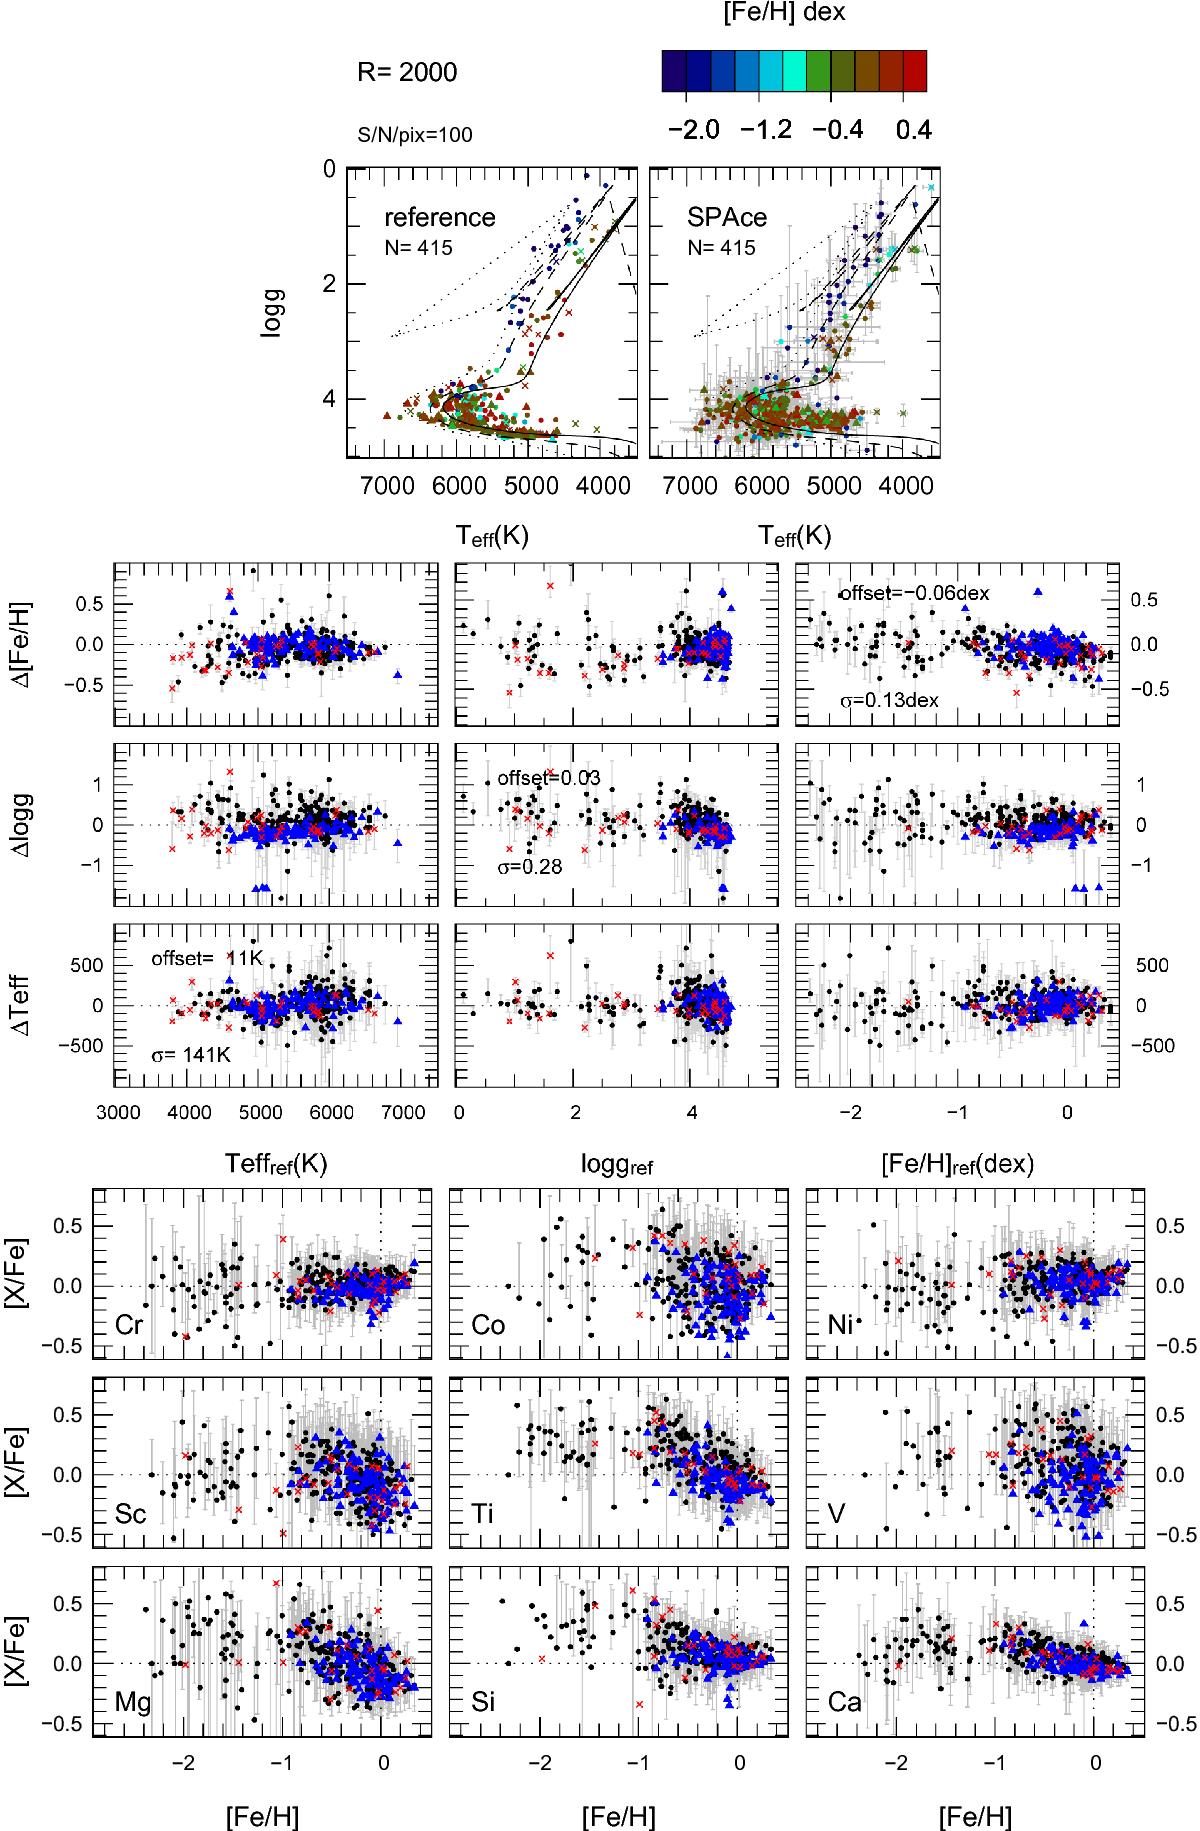
Top: distribution of the reference Teff and log g of real spectra (top-left panel) and the ones derived by SP_Ace (top-right panel). Middle: residuals between derived and reference parameters (y-axis) as a function of the reference parameters (x-axis). Bottom: chemical abundances derived by SP_Ace for the same spectra. These spectra have a resolution of R = 2000 and S/N/pixel = 100. The symbols are as in Fig. 23.
Current usage metrics show cumulative count of Article Views (full-text article views including HTML views, PDF and ePub downloads, according to the available data) and Abstracts Views on Vision4Press platform.
Data correspond to usage on the plateform after 2015. The current usage metrics is available 48-96 hours after online publication and is updated daily on week days.
Initial download of the metrics may take a while.