Fig. B.1
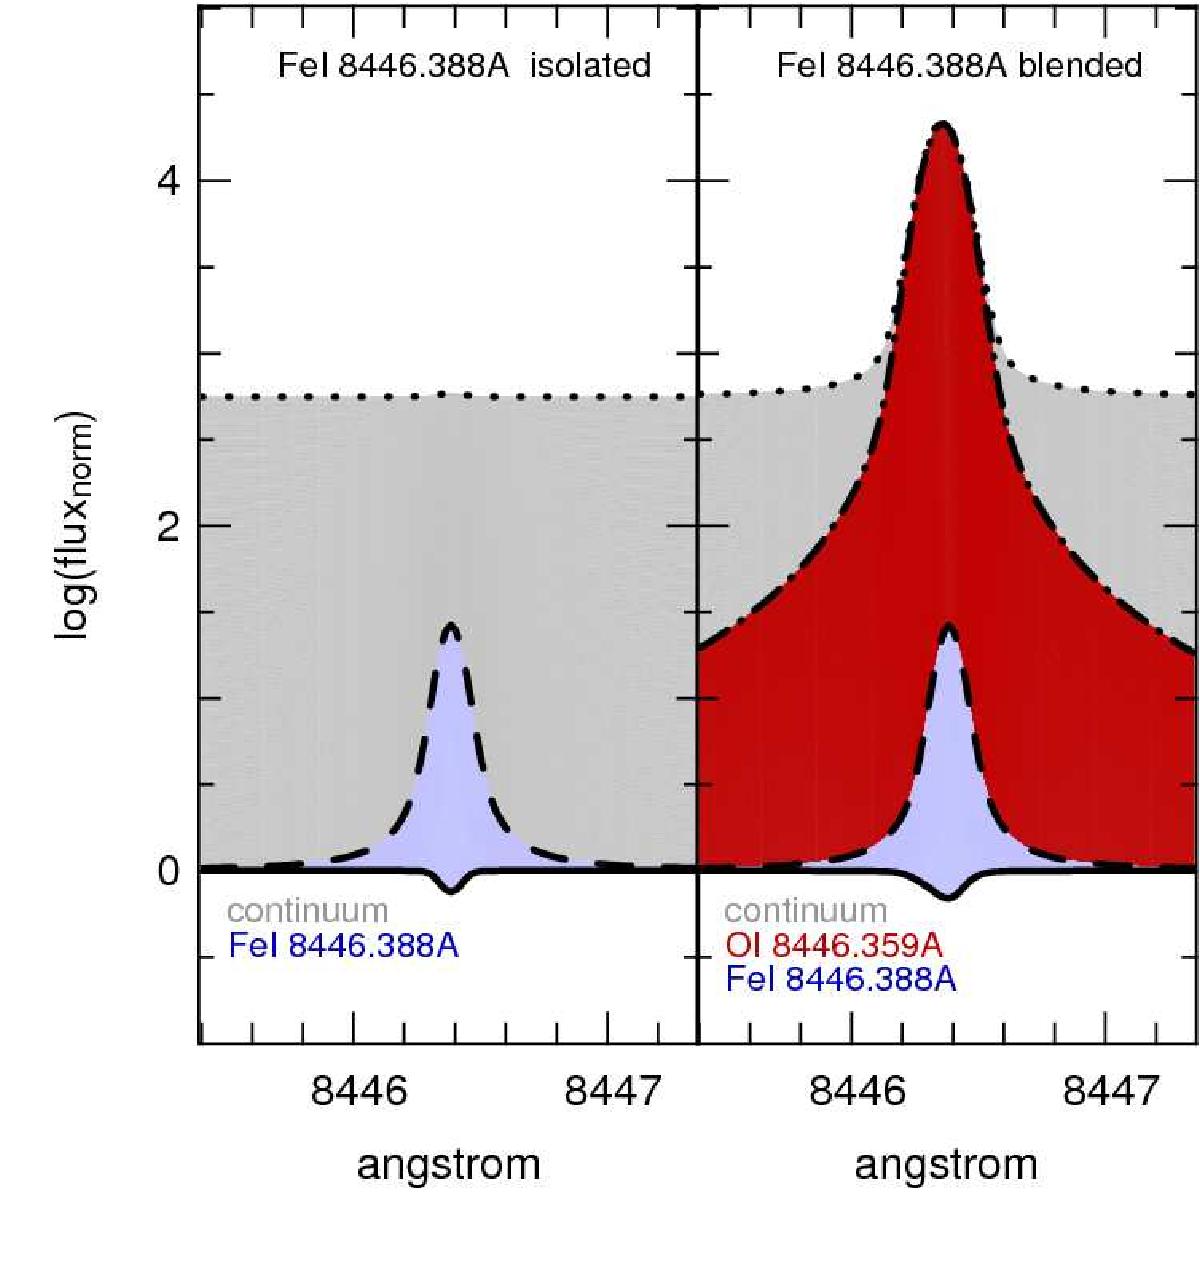
Left panel: the black solid line represents the Fe i line at 8446.338 Å synthesized as isolated line, i.e., the emerging flux when the line and continuum absorptions are accounted for. The dashed line represent the flux in presence of the line when the continuum absorption alone is accounted for. The dotted line represent the emerging flux when the emissions alone are accounted for. The gray area represents the flux absorbed by the continuum, while the light blue area is the flux absorbed by the line. Right panel: as in the left panel, but for the two blended lines OI and FeI lines at 8446.359 Å and 8446.338 Å, respectively. The flux absorbed by the continuum and the Fe line are still represented by the gray and light blue areas, respectively, while for the OI line the absorbed flux is the red area. The y-axis represents the logarithm (base 10) of the normalized flux.
Current usage metrics show cumulative count of Article Views (full-text article views including HTML views, PDF and ePub downloads, according to the available data) and Abstracts Views on Vision4Press platform.
Data correspond to usage on the plateform after 2015. The current usage metrics is available 48-96 hours after online publication and is updated daily on week days.
Initial download of the metrics may take a while.