Fig. 23
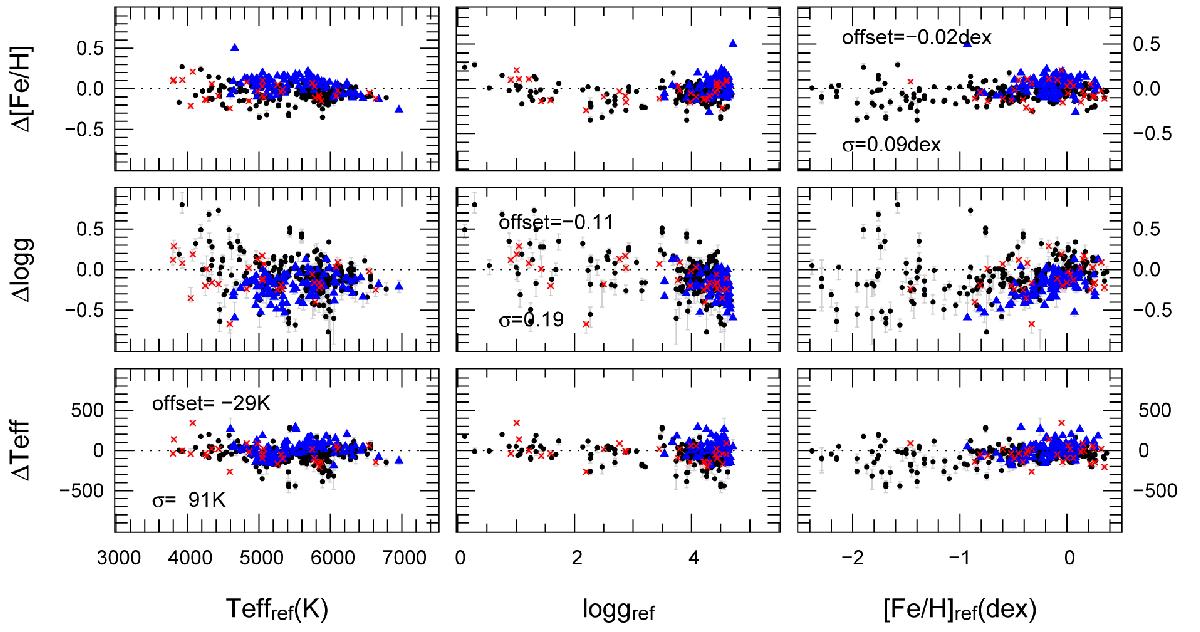
Residuals between derived and reference parameters (y-axis) as a function of the reference parameters (x-axis). ELODIE, benchmark, and S4N stars are indicated with black points, red crosses, and blue triangles, respectively. Errorbars are reported in light gray. A missing errorbar indicate that the error is larger than the parameters grid.
Current usage metrics show cumulative count of Article Views (full-text article views including HTML views, PDF and ePub downloads, according to the available data) and Abstracts Views on Vision4Press platform.
Data correspond to usage on the plateform after 2015. The current usage metrics is available 48-96 hours after online publication and is updated daily on week days.
Initial download of the metrics may take a while.