Fig. 20
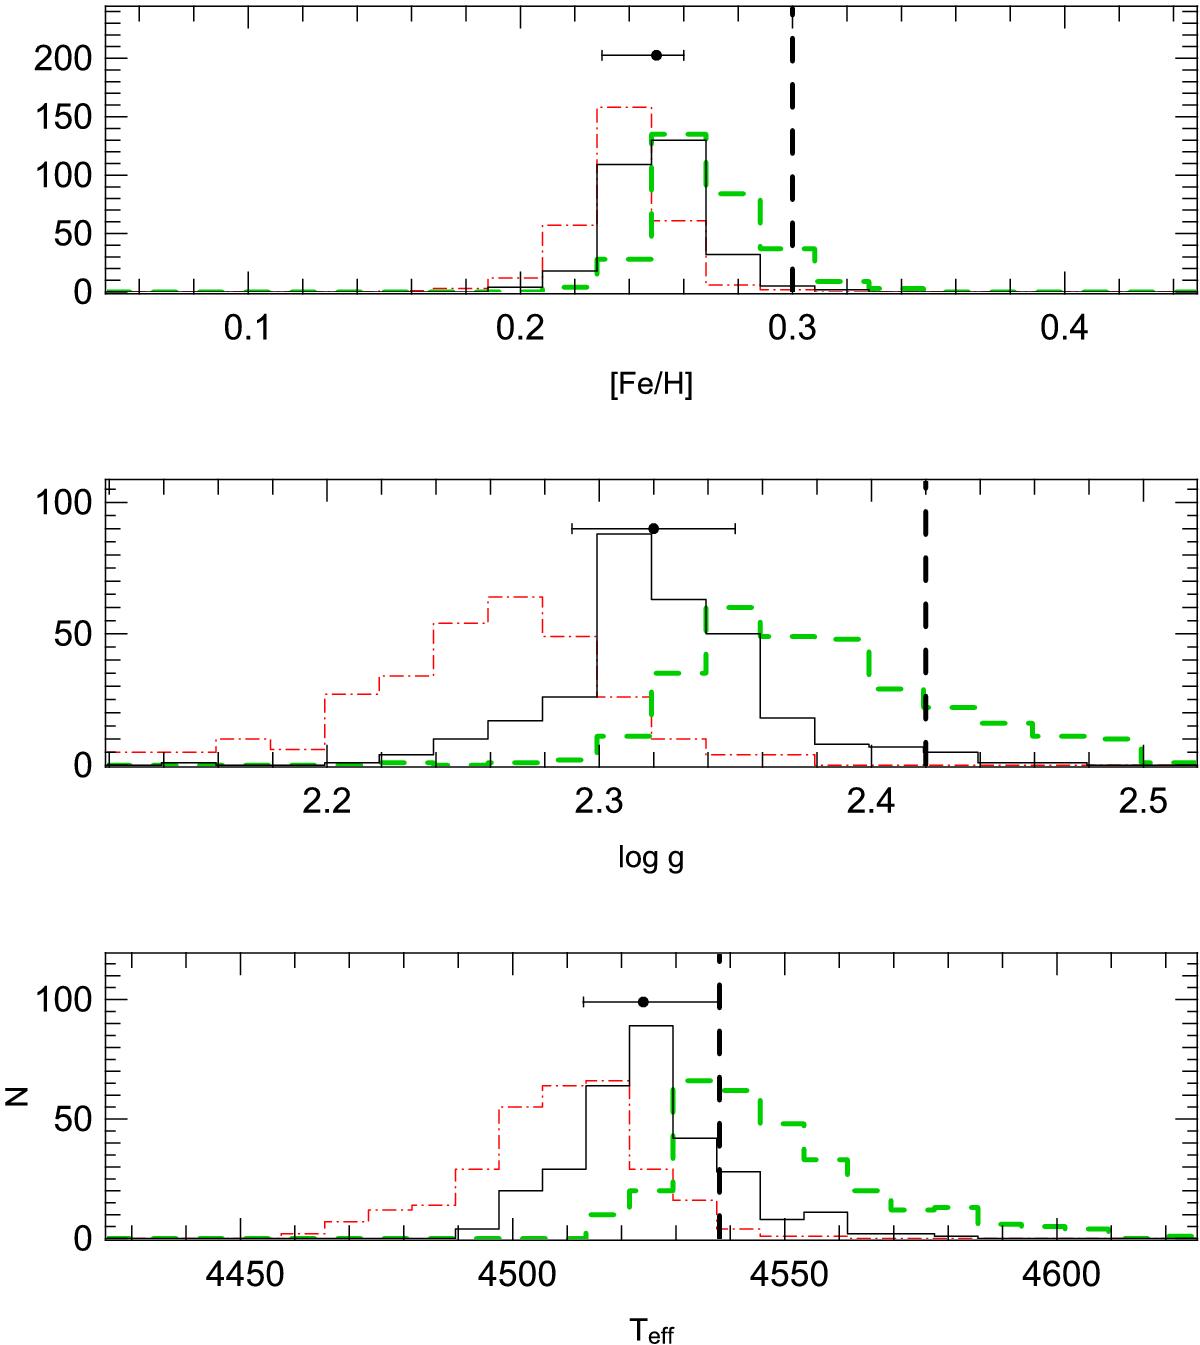
Distributions of the derived stellar parameters (black solid histogram), and the lower and upper limits of the confidence intervals (dotted-dashed red histogram and thick dashed green histogram, respectively) as computed in Sect. 7.6 for 100 Monte Carlo realizations of the synthetic spectrum with Teff = 4538 K, log g = 2.42, [Fe/H] = 0.30 dex, S/N = 100, and R = 12 000. The black point represents the median of the derived stellar parameters while the errorbars show the lower and upper limit of the interval that holds the 68% of the measurements. The vertical dashed lines represent the reference values.
Current usage metrics show cumulative count of Article Views (full-text article views including HTML views, PDF and ePub downloads, according to the available data) and Abstracts Views on Vision4Press platform.
Data correspond to usage on the plateform after 2015. The current usage metrics is available 48-96 hours after online publication and is updated daily on week days.
Initial download of the metrics may take a while.