Free Access
Fig. 18
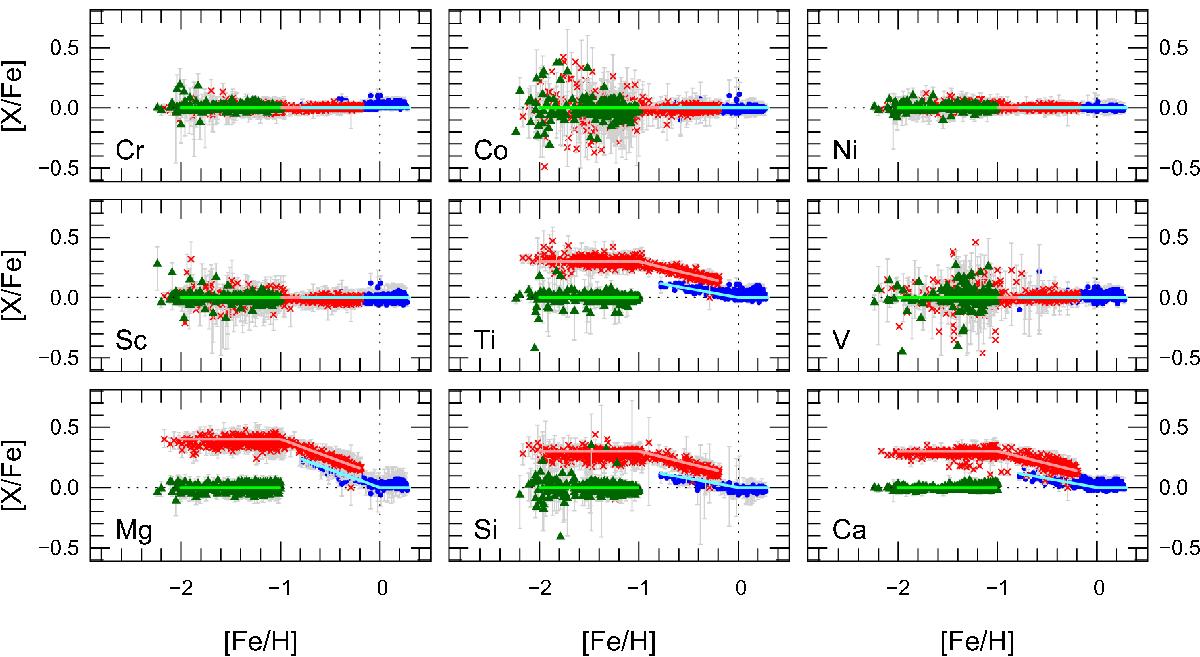
Chemical abundances derived by SP_Ace for the three mock populations. Symbols and colors are as in Fig. 16. The reference abundances of these three populations are represented by the light blue, light red, and light green solid lines for the thin disc, the halo/thick disc, and accreted populations, respectively.
Current usage metrics show cumulative count of Article Views (full-text article views including HTML views, PDF and ePub downloads, according to the available data) and Abstracts Views on Vision4Press platform.
Data correspond to usage on the plateform after 2015. The current usage metrics is available 48-96 hours after online publication and is updated daily on week days.
Initial download of the metrics may take a while.