Fig. 16
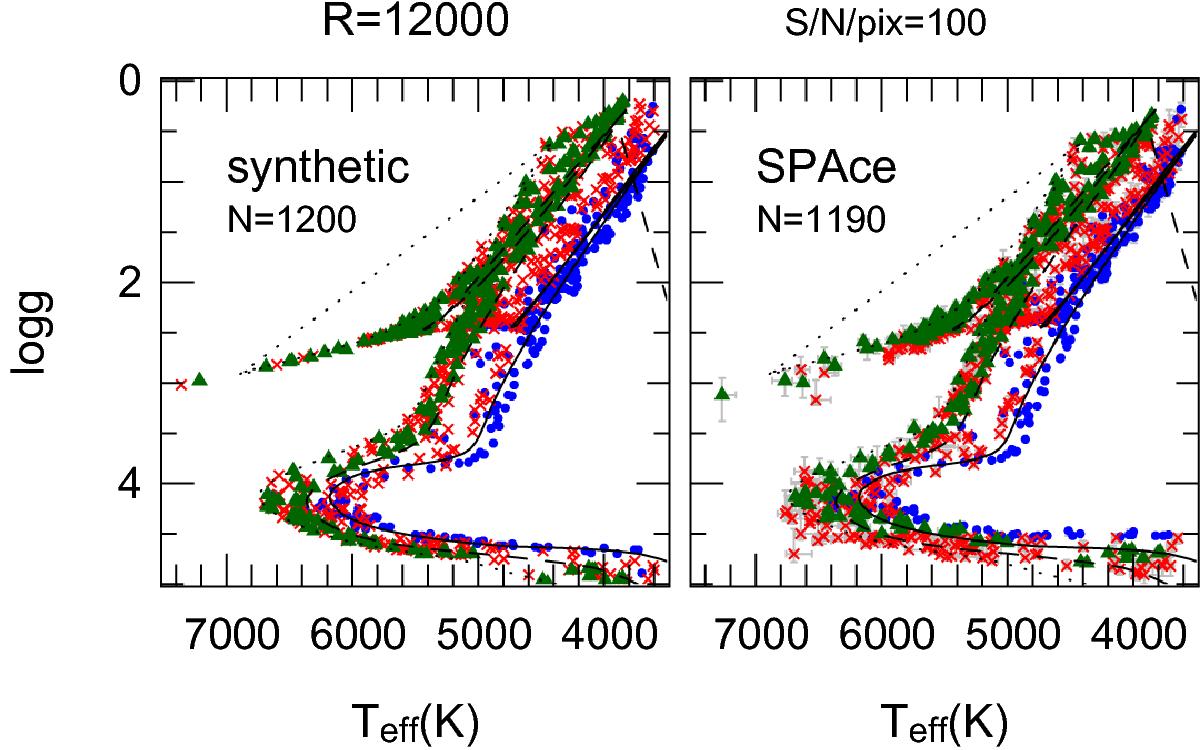
Distribution of the three mock populations on the Teff and log g plane as synthesized (left panels) and derived by SP_Ace (right panel). The blue points, red crosses, and green triangles represent the thin, halo/thick disc, and accreted stars, respectively. The solid, dashed, and dotted black lines show isochrones at [M/H] = 0.0 dex and 5 Gyr, [M/H] = −1.0 dex and 10 Gyr, and [M/H] = −2.0 dex and 10 Gyr, respectively. The light gray errorbars represent the confidence intervals of the individual measurements. A missing errorbar indicates that the error is larger than the parameter grid.
Current usage metrics show cumulative count of Article Views (full-text article views including HTML views, PDF and ePub downloads, according to the available data) and Abstracts Views on Vision4Press platform.
Data correspond to usage on the plateform after 2015. The current usage metrics is available 48-96 hours after online publication and is updated daily on week days.
Initial download of the metrics may take a while.