Fig. 15
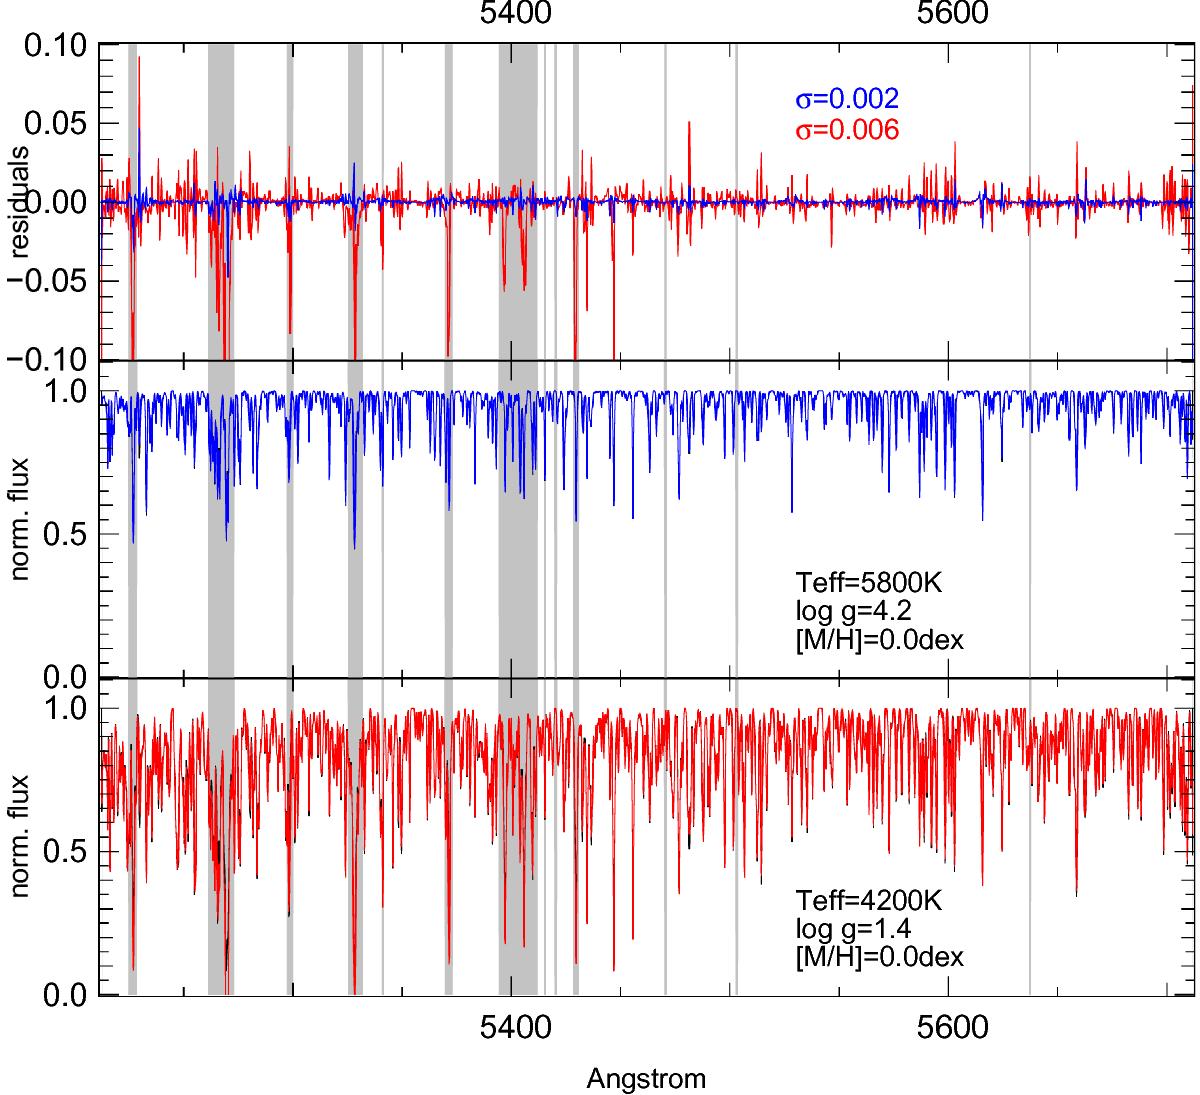
Comparison between spectra models and the corrispondent synthetic spectra. The black lines are synthetic spectra of a cool giants stars (bottom panel) and a warm dwarf stars (middle panel) with stellar parameters as reported in the panels. The overplotted colored lines represent the spectrum models constructed by SP_Ace for the corrispondent giant (red line) and dwarf (blue line) star. The shaded areas indicate the wavelength ranges rejected during the SP_Ace analysis (see text for more details). The residuals (model minus synthetic spectra) are reported in the top panel, together with the standard deviation of the residuals for the dwarf and giants spectra (in blue and red colors, respectively) after the exclusion of the gray shaded areas.
Current usage metrics show cumulative count of Article Views (full-text article views including HTML views, PDF and ePub downloads, according to the available data) and Abstracts Views on Vision4Press platform.
Data correspond to usage on the plateform after 2015. The current usage metrics is available 48-96 hours after online publication and is updated daily on week days.
Initial download of the metrics may take a while.