Fig. 13
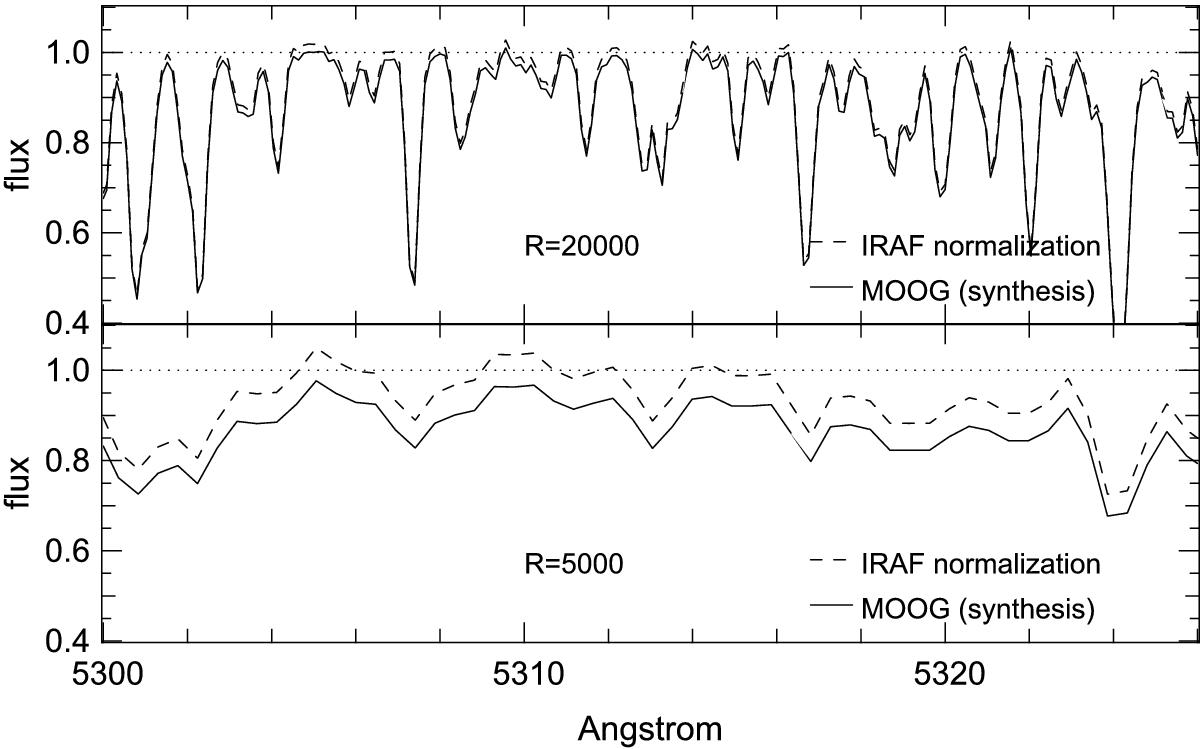
Synthetic spectrum with the stellar parameters Teff = 4212 K, log g = 1.8, [M/H] = 0.0 dex, and S/N = 100 at resolution R = 20 000 (top) and R = 5000 (bottom). The black line is the correctly normalized spectrum (synthesized by MOOG and noise added), while the dashed line is the same spectrum after normalization with the task continuum of IRAF.
Current usage metrics show cumulative count of Article Views (full-text article views including HTML views, PDF and ePub downloads, according to the available data) and Abstracts Views on Vision4Press platform.
Data correspond to usage on the plateform after 2015. The current usage metrics is available 48-96 hours after online publication and is updated daily on week days.
Initial download of the metrics may take a while.