Fig. 12
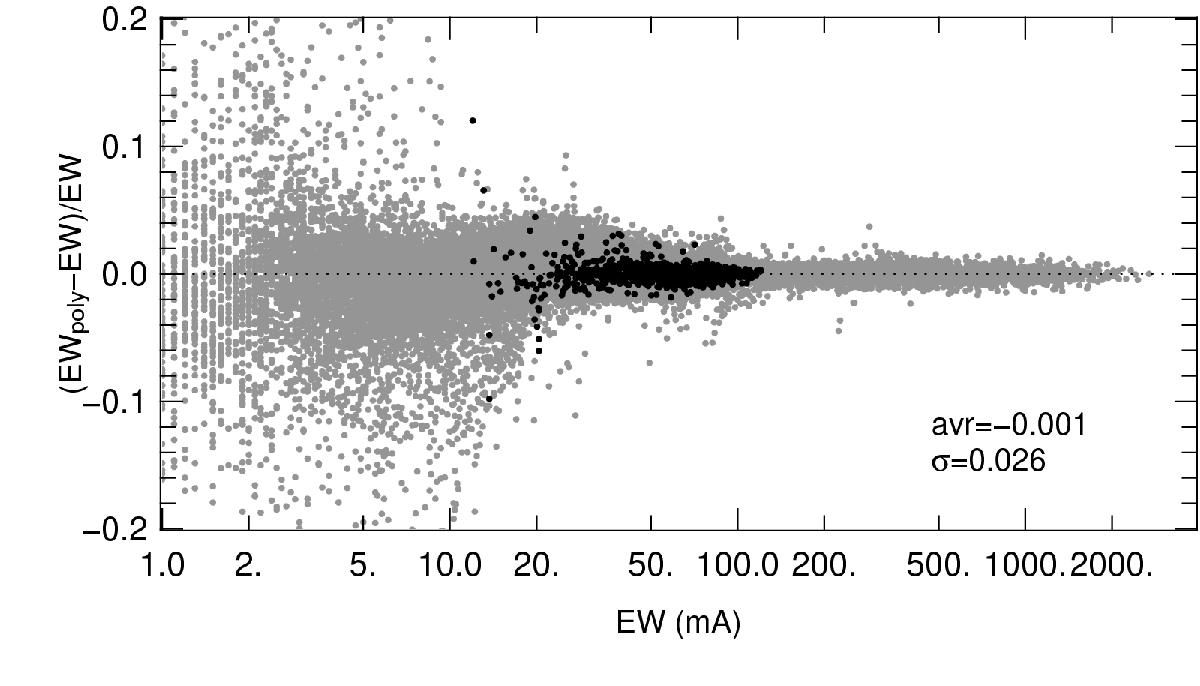
Grey points: residuals between the EW given by the polynomial GCOG and the EW of the library as a function of EW for 100 absorption lines (in the range 5212–5235 Å) at the grid point Teff = 4200 K, log g = 1.4 and [M/H] = 0.0 dex. Black points: as before but for the line Fe i at 5231.395 Å alone. The residuals are normalized for the EW so that the values in the y-axis and the statistic in the panel express the errors of the polynomial GCOG normalized to the expected EW.
Current usage metrics show cumulative count of Article Views (full-text article views including HTML views, PDF and ePub downloads, according to the available data) and Abstracts Views on Vision4Press platform.
Data correspond to usage on the plateform after 2015. The current usage metrics is available 48-96 hours after online publication and is updated daily on week days.
Initial download of the metrics may take a while.