| Issue |
A&A
Volume 587, March 2016
|
|
|---|---|---|
| Article Number | A30 | |
| Number of page(s) | 8 | |
| Section | Interstellar and circumstellar matter | |
| DOI | https://doi.org/10.1051/0004-6361/201526623 | |
| Published online | 15 February 2016 | |
Search for systemic mass loss in Algols with bow shocks
1
University of ViennaDepartment of Astrophysics,
Sternwartestraße 77,
1180
Wien,
Austria
e-mail:
This email address is being protected from spambots. You need JavaScript enabled to view it.
2
Institut d’Astronomie et d’Astrophysique, Université Libre de
Bruxelles, CP 226, Av. F. Roosevelt
50, 1050
Brussels,
Belgium
3
European Southern Observatory, Alonso de Cordova 3107, 19001 Casilla,
Santiago,
Chile
Received: 28 May 2015
Accepted: 24 December 2015
Abstract
Aims. Various studies indicate that interacting binary stars of Algol type evolve non-conservatively. However, direct detections of systemic mass loss in Algols have been scarce so far. We study the systemic mass loss in Algols by looking for the presence of infrared excesses originating from the thermal emission of dust grains, which is linked to the presence of a stellar wind.
Methods. In contrast to previous studies, we make use of the fact that stellar and interstellar material is piled up at the edge of the astrosphere where the stellar wind interacts with the interstellar medium. We analyse WISE W3 12 μm and WISE W4 22 μm data of Algol-type binary Be and B[e] stars and the properties of their bow shocks. From the stand-off distance of the bow shock we are able to determine the mass-loss rate of the binary system.
Results. Although the velocities of the stars with respect to the interstellar medium are quite low, we find bow shocks present in two systems, namely π Aqr, and ϕ Per; a third system, CX Dra, shows a more irregular circumstellar environment morphology which might somehow be related to systemic mass loss. The properties of the two bow shocks point to mass-loss rates and wind velocities typical of single B stars, which do not support an enhanced systemic mass loss.
Key words: binaries: close / circumstellar matter / infrared: stars / stars: winds, outflows
© ESO, 2016
1. Introduction
The group of Algols host stars with many different observed properties, like W Ser stars, β Lyræ stars, binary B[e] and Be stars, and symbiotic Algols, which all have in common the paradox that the donor star is more evolved but less massive than the accretor. This is achieved by mass transfer when at a certain point the mass ratio reverses. Non-conservative evolution in Algol-type binary systems has been known for 60 years (Crawford 1955). For example Chaubey (1979), Sarna (1993), and van Rensbergen et al. (2011) noted that Algol models must lose a significant fraction of their mass to reproduce observed properties. One of the most efficient scenarios that removes mass from the system is via a hotspot on the surface of the gainer1. However, no direct detection of systemic mass loss during the mass transfer process in close binaries has been reported for Algols so far.
In this work, we focus on Be and B[e] stars for which binarity has been confirmed and the properties of the systems are well constrained. A Be star is a non-supergiant B star whose spectrum has, or had at some time, one or more Balmer lines in emission, and might also show infrared (IR) excess (Collins 1987). The origin of these spectral features in these binary Be stars is probably linked to the mass-transfer event (Porter & Rivinius 2003). The IR excess is most likely caused by hot circumstellar dust (Lamers et al. 1998), which is present in the case of an evolved binary system associated with mass transfer events (e.g. Dunstall et al. 2012). B[e] stars also have strong forbidden (Fe) emission lines.
We take advantage of the fact that some of these stars are not at rest, but move with a certain speed with respect to their surrounding medium. Assuming that mass is expelled supersonically from the binary system, it is decelerated by the oncoming interstellar medium (ISM) and forms a bow shock (Baranov et al. 1971; Weaver et al. 1977). Bow shocks have been observed at all kinds of wavelengths around many stellar types, covering runaway O stars to asymptotic giant branch (AGB) stars (e.g. van Buren & McCray 1988; Cox et al. 2012). In the mid-IR, these shocks are visible through thermal dust emission, when the shock front heats up dust grains at the interface between the stellar wind and the ISM (Ueta et al. 2006). A bow shock detection around an Algol is therefore direct evidence of stellar material around the binary system. In this case, the distance of the system to the apex of the bow shock can be used to derive the systemic mass-loss rate if the wind velocity, stellar velocity, and ISM density are known (Baranov et al. 1971).
This research note is a complementary study to the work done by Deschamps et al. (2015, hereafter D15), but with emphasis on the observational aspects of the systemic mass loss. Based on radiative transfer calculations, Deschamps et al. (2015, their Fig. 13) predicted the IR colour excesses expected in the case of systemic mass loss. In addition to the WISE detections of extended material around CZ Vel and SX Aur presented in D15, we discuss the properties of the circumstellar emission (CSE) of three other objects, namely CX Dra, π Aqr, and ϕ Per.
2. WISE observations
In D15, we performed a systematic search for extended IR emission around Algols (collected from the catalogues of Brancewicz & Dworak 1980; and Budding et al. 2004)and Algol-related Be and B[e] systems (Harmanec 2001), using archive data from the Wide-field Infrared Survey Explorer (WISE)2. WISE is an all-sky survey, which mapped the sky in four bands at 3.4, 4.6, 12, and 22 μm with angular resolutions of 6 1, 64, 65, and 120, respectively (Wright et al. 2010). Based on the list of 70 objects (Algols and Algol-like Be stars with a WISE-source counterpart) provided by D153, we found that three systems, CX Dra, π Aqr, and ϕ Per, have unambiguous CSE and therefore deserve a specific analysis (in addition to CZ Vel and SX Aur, already discussed in D15).
All three objects are in the list of binary Be stars compiled by Harmanec (2001). They exhibit peculiarities that flag them as Algol candidates, or at least as systems with on-going mass transfer. With its sdO companion, ϕ Per has obviously undergone a severe mass transfer, the primary and more luminous B2[e] component being the most massive but the least evolved. In CX Dra, mass transfer in the binary has been inferred from the variation of the polarisation with orbital phase, and from the fact that the less massive, more evolved F5III companion fills its Roche lobe (Berdyugin & Piirola 2002). In π Aqr photometric, spectroscopic (broad and complex Hα line profile), and polarimetric variations observed during the second half of the 20th century are tentatively attributed to variable mass transfer between the binary components (Bjorkman et al. 2002; Hanuschik et al. 1996).
The extended emission around the stars was detected in Band 3 (W3) at 12 μm (CX Dra, π Aqr) and Band 4 (W4) at 22 μm (CX Dra, π Aqr, ϕ Per). For the two objects with CSE detected in both bands, WISE W4 offers greater details, most likely because the thermal emission of the shock-heated dust grains peaks at longer wavelengths (Draine 1981). In the following, the circumstellar material (CSM) morphology of the three objects is described. Figures 1–5 depict the WISE images of CX Dra, π Aqr, and ϕ Per, while Table 1 provides their stellar properties.
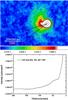 |
Fig. 1 Upper panel: WISE W4 image of CX Dra at 22 μm. The continuous black arrow gives the uncorrected proper motion from the reprocessed Hipparcos catalogue (van Leeuwen 2007), while the dashed arrow points to the direction of the space motion corrected from the solar motion (Coşkunoǧlu et al. 2011). The values of the motion are given in Table 1. The values of the colour bar are given in Jy pix-1. Lower panel: Integrated intensity cut through a wedge covering position angles (PA): 45°–135°. |
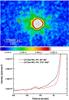 |
Fig. 2 Upper panel: WISE W3 images of CX Dra at 12 μm. Lower panel: integrated intensity cuts through a wedge covering PA: 30°–65° (black line) where emission is visible and PA: 210°–245° (red line) without extended emission. We had to choose smaller wedges to avoid the flux being dominated by the diffraction spikes of the PSF. |
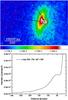 |
Fig. 3 Same as Fig. 1 for π Aqr. The integrated intensity cut in the lower panel covers PA: 45°–135°. |
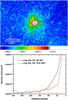 |
Fig. 4 Same as Fig. 2 for π Aqr at 12 μm. The integrated intensity cuts in the lower panel cover PA: 30°–65° (black line) where emission is visible and PA: 210°–245° (red line) without extended emission. |
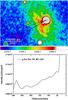 |
Fig. 5 Same as Fig. 1 for ϕ Per. The integrated intensity cut in the lower panel covers PA: 80°–165°. The peaks at distances of about 223″ and 283″ in the lower panel correspond to the stars visible in the image at position angles of 99° and 164°, respectively. |
2.1. CX Dra
CX Dra (HIP 92133) is a 6.696 d period Algol B2.5Ve+F5III system at a distance of 396 pc (van Leeuwen 2007); one of the components rotates rapidly. Although it is not eclipsing, Berdyugin & Piirola (2002) estimate the mass of the two components to be 3.9 M⊙ and 0.9 M⊙ at i = 70°. The authors, however, correctly note that these masses are too small to match the spectral types of the two stars.
The circumstellar environment of the star is shown in Figs. 1 and 2. The emission in the WISE W4 22 μm band is concentrated to the east of the star and is traceable to a distance of about 120″ (47 500 au at 396 pc). The morphology of the CSM is somewhat puzzling because several aspects are not in favour of an ISM interaction. First, the direction of the proper motion is S-E, but the shape of the emission is not symmetric and is more concentrated N-E of the star. Second, the emission is not detached from the star and the flux seems to decrease with distance, which is not expected for a bow shock where the brightest region is at the position of the shock front.
Furthermore, the CSM of CX Dra on the WISE image describes an arc emerging east of the star and curved towards the north. Similar arcs are found to be part of an Archimedean spiral which is caused by a semi-detached companion interacting with the wind of a primary (e.g. Mastrodemos & Morris 1999; Mayer et al. 2011; Maercker et al. 2012). The spacing of the spiral arms is thereby defined by the wind velocity of the mass losing star and the orbital period of the companion. However, assuming a wind velocity of 1000 km s-1 for the B2.5Ve star and an orbital period of 6.696 d for the F5III companion, the resulting spiral spacing is 3.87 au, which is several orders of magnitude smaller than what is seen on the WISE image. For comparison, the pixel size of the image is  , which is 545 au at 396 pc. This implies that a spiral formed by the B2.5Ve+F5III system would show 140 windings per WISE W4 pixel. The observed arc is therefore not related to this shaping mechanism.
In the colour-colour diagram shown in Fig. 13 of D15 that depicts the WISE W4/W1 against 2MASS J/Ks flux ratios, CX Dra is located only slightly above the black-body curve (FJ/FKs = 1.678, FW4/FW1 = 0.047). Many other objects fall into this region of the diagram and no peculiarity can be drawn from it. Still, there is no doubt that extended emission is present in the WISE W4 image.
In the shorter WISE W3 band at 12 μm (see Fig. 2), CX Dra also shows extended emission east of the star but in much less detail than in the W4 image. The detection of emission in W3 and W4, however, allows us to estimate the temperature of the dust emission around CX Dra. We performed aperture photometry on a circle of radius 15″ in both bands. The region we chose is centred at a distance of 56″ from the star at PA = 48° and falls between the diffraction spikes of the PSF which is dominating the W3 image. The resulting fluxes are Fν,12 = 0.207 Jy and Fν,22 = 1.650 Jy at 12 μm and 22 μm, respectively. Adopting the corresponding absorption coefficients of astronomical silicates Qabs,12 = 5.60 × 10⁻² and Qabs,22 = 3.39 × 10⁻² (Draine 1985), the 12 μm and 22 μm fluxes correspond to a temperature of 124 K (for details see Jorissen et al. 2011).
Since no other archival observations are available for CX Dra, we cannot conclude on the shaping mechanism of its CSM. We note, however, that the star might be a possible candidate for showing systemic mass loss in its circumstellar environment, but further observations are needed.
2.2. π Aqr
Pi Aquarii (HIP 110672) is a 84.1 d period binary located 240 pc from the sun (van Leeuwen 2007). The system comprises a rapidly rotating B1Ve star at the origin of the Be phenomenon and an A-F type companion. Bjorkman et al. (2002) estimate the mass of the components to be M1sin3i = 12.4 M⊙ and M2sin3i = 2.0 M⊙ with an orbital inclination i = (50−75)°. The stellar wind is one of the fastest among the Be stars with a terminal velocity of 1450 km s-1; the mass-loss rate is one of the highest with Ṁ = 2.61 × 10⁻⁹ M⊙ yr-1 estimated from the Si iv profile (Snow 1981). We note that the Si iv lines likely form inside the Roche lobe of the gainer star and might therefore not trace the systemic mass-loss rate.
The WISE W4 image of π Aqr is depicted in Fig. 3. The emission shows a morphology that is typical for a wind-ISM interaction with a bow shock in the direction of the space motion. The bow shock cone is quite symmetric on the northern and southern half, extending to about 220″ (52 800 au at 240 pc) in those directions. In the direction of motion, the material can be traced to about 150″ (36 000 au) from the binary system. The emission peak, however, is closer to the system at about 52″ (12 480 au).
In WISE W3 at 12 μm (see Fig. 4), the CSE is concentrated to the east of the star at the same position where the bow shock in W4 is visible, but not as extended in the north-south direction. The lower panel of Fig. 4 shows cuts through regions with and without extended emission.
In the same manner as for CX Dra, we also performed aperture photometry (r = 15″) for π Aqr in both bands at a region centred at a distance of 61″ from the star at PA = 46°. The resulting fluxes are Fν,12 = 0.481 Jy and Fν,22 = 4.411 Jy at 12 μm and 22 μm, respectively. Adopting the same absorption coefficients of astronomical silicates as for CX Dra, the 12 μm and 22 μm fluxes correspond to a temperature of 120 K.
2.3. ϕ Per
Phi Persei (HIP 8068) is a long period Algol B2[e]+sdO system (Porb = 127 d) at a distance of 220 pc (van Leeuwen 2007). The system is likely at the end of its mass-transfer phase (Gies et al. 1998) and the material transferred from the donor star has largely spun up the gainer star (primary) to the rotation rate now observed. Based on double-line spectroscopic orbital elements, the masses of the components have been estimated to be 9.3 ± 0.3 M⊙ for the B[e] primary and 1.14 ± 0.04 M⊙ for the sdO secondary (donor star). A hotspot region detected on the edge of the disc produces strong Fe iv lines. The envelope of the companion has mostly been stripped off by the Roche-lobe overflow (RLOF) event and the secondary, now a hot sdO star, is only visible in the UV.
The WISE W4 22 μm emission of ϕ Per is shown in Fig. 5. The CSM is elliptically shaped with the major axis approximately in the N-S direction. The extent of the emission to the south is about 290″ (63 800 au at 220 pc), while the frame is cut off in the north 250″ from the star. East of the star at ≈100″ (22 000 au), a brightened bar is visible with the same N-S orientation as the whole elliptical emission and a length of about 240″ (52 800 au). The bar is bent towards the star at the same position angle as the direction of the space motion, which indicates that this is the interface where the ISM interacts with the stellar material. These bendings are visible in hydrodynamic simulations of bow shocks where the shocked stellar and ambient material cool efficiently (see Fig. 15 in Comeron & Kaper 1998). A beautiful example of a bent bow shock is found around the AGB star X Her (Jorissen et al. 2011). In contrast to the other two objects, ϕ Per does not show extended emission in WISE W3.
Stellar properties.
3. Bow shock properties and systemic mass loss
For a star that moves with respect to its surrounding medium, the stellar motion adds an asymmetry to the wind velocity profile, since different parts of the wind face the ISM with different relative velocities. If the motion is supersonic, a bow shock arises at the interface where the ram pressure of the ISM and the stellar wind balance. The stand-off distance, i.e. the distance of the star to the apex of the shock front, is given by 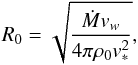 (1)where vw is the terminal wind velocity, v∗ the stellar velocity with respect to the ISM, Ṁ the mass-loss rate, and ρ0 the density of the surrounding medium (Baranov et al. 1971). The density can be expressed in number density of hydrogen atoms (mH = 1.6727 × 10⁻²⁷ kg), which follows roughly
 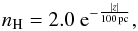 (2)where z is the galactic height (Mihalas & Binney 1981) and nH is given in atoms per cm3. Wilkin (1996) demonstrated that the shape of the bow shock only depends on the stand-off distance, while Cox et al. (2012) showed that this assumption remains valid for viewing angles up to 70°. Above this value, the bow shock cone becomes broader. Therefore, we were able to use Eq. (1) to estimate the mass-loss rate from the binary system by measuring the stand-off distance. Generally, the ISM density and stellar velocity can be determined following Eq. (2) and Johnson & Soderblom (1987), respectively. While the error of the space motion is negligible, the ISM density value is only an estimate since the star could move through a dense cloud, which is not considered by Eq. (2). The respective values of these quantities for the three objects are given in Table 1. To obtain the space motion (v∗ ,LSR) with respect to the local standard of rest, we corrected the heliocentric motions from the solar motion vector (U,V,W)⊙ = (8.50 ± 0.29,13.38 ± 0.43,6.49 ± 0.26) km s-1 (Coşkunoǧlu et al. 2011). However, since the proper motions are quite small (a few mas yr-1), the correction for the solar motion has a large impact, especially on the PA of the motion. Interestingly, the PA of the corrected LSR motion is a worse match to the bow-shock orientation than the PA of the uncorrected motion (see Figs. 1, 3, and 5). Using (U,V,W)⊙ = (10.00 ± 0.36,5.25 ± 0.62,7.17 ± 0.38) km s-1 determined from the Hipparcos data by Dehnen & Binney (1998) leads to vLSR velocities which are slightly closer to the better matching heliocentric values. A similar discrepancy between bow-shock orientation and LSR motion (and less so with heliocentric motion) is found by Peri et al. (2012, 2015) for a large number of O- and B-type stars with bow shocks, as collected in the WISE E-BOSS survey. For this reason, we overplotted both the heliocentric and LSR motions on the WISE images in Figs. 1, 3, and 5.
Sarna (1993), van Rensbergen et al. (2011), and more recently Deschamps et al. (2013, 2015) have suggested that Algols lose a significant fraction of their initial mass during the mass-transfer phase. van Rensbergen et al. (2011) state that a hotspot mechanism may be invoked to remove up to 15% of the binary-system initial mass. In this scenario, those parts of the stellar surface hit by the RLOF stream (the hotspot) emit radiation whose pressure triggers mass loss at a rate of up to 10-5 M⊙ yr-1. Such a high mass-loss rate would change the size of the bow shock considerably. Moreover, a stream winding around the binary system forms (see Fig. 1 of D15), possibly altering the shape of the bow shock as well.
In order to identify the origin of the mass causing the observed bow shocks, one has to evaluate the dynamical age of the bow shock. The distance of the bow shocks to the central system is 22 000 au and 36 000 au for ϕ Per and π Aqr, respectively. If the bow shocks are caused by systemic mass loss triggered by a hot spot, the wind velocity is about 1000 km s-1 (see Fig. 3 of D15) and the resulting kinematic ages of the bow shocks are of the order of 100 yr, much shorter than the duration of the mass-transfer phase in Algol systems (105 yr; Deschamps et al. 2013). Therefore, for Algols currently in the rapid mass-transfer phase, if a bow shock is present it will stay for the whole duration of the mass transfer.
Since the wind velocities of π Aqr and ϕ Per are not known, we cannot directly use Eq. (1) to relate the bow-shock stand-off distance to the mass-loss rate causing the bow shock and then compare the latter with the predictions of systemic mass-loss rates from the hotspot scenario of D15. Nevertheless, the relation between the mass-loss rate and the wind velocity may help us to evaluate the likelihood of systemic mass loss triggered by the hotspot scenario. In these calculations, we used the ISM densities ρ0 = nH × mH and space velocities v∗ ,LSR listed in Table 1 with stand-off distances of R0 = 36 000 au for π Aqr and R0 = 22 000 au for ϕ Per, as measured on the WISE images. Figure 6 depicts the relationship between mass-loss rate and wind velocity for π Aqr. The colours show the differences in the calculated R0 to the observed value of 36 000 au.
For an expected wind velocity between 700 and 1500 km s-1, only a small range of mass-loss rates from 4 × 10⁻¹⁰ M⊙ yr-1 to 4 × 10⁻⁹ M⊙ yr-1 can match the observed stand-off distance (± 5000 au) of the bow shock around π Aqr. This range of mass-loss rates is well below the systemic mass-loss rate inferred from the hotspot scenario (of the order of 10-5 M⊙ yr-1). Such a high mass-loss rate in combination with a wind velocity of ≈1000 km s-1 would cause a stand-off distance that is a factor of 100 larger than observed. To bring the wind velocity in line with the proposed Ṁ from the hotspot scenario and with the observed R0, it has to decrease almost to 0. In other words, it is highly unlikely that a systemic mass loss of the order of 10-5 M⊙ yr-1 is currently present in π Aqr. If systemic mass loss is ongoing, it does not exceed 10-8 M⊙ yr-1. We emphasise, however, that the mass-loss rate of π Aqr inferred from the bow-shock properties fits well the value observed for the Be star (2.61 × 10⁻⁹ M⊙ yr-1; Snow 1981). We obtain similar results For ϕ Per: Ṁ = 2 × 10⁻¹⁰ – 6 × 10⁻⁹ M⊙ yr-1 for vw = 700–1500 km s-1 for a measured R0 of 22 000 ± 5000 au.
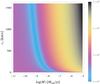 |
Fig. 6 Density plot relating the mass-loss rate and wind velocity of π Aqr to the bow-shock stand-off distance R0. The colours indicate the difference in au to the measured R0 = 36 000 au. |
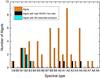 |
Fig. 7 Distribution of Algols among early spectral types (orange bars), along with those with detected extended emission in the WISE W4 band (cyan bars) and with W4/W1 flux ratios falling above the black-body line (black bars). |
The Be star wind as the origin of the bow shock is further demonstrated by the fact that the bow shocks discovered in the present study are restricted to early-type B stars (Figs. 7, 8). Our sample also includes a O9.7Ibe star, RY Sct, which shows a high WISE W4/W1 flux ratio. However, RY Sct is much farther away than the three B stars discussed in the present paper since it has a parallax not significantly different from zero (van Leeuwen 2007); hence, if present, the extended emission would be hardly detectable. Given that the V magnitude of RY Sct (O9.7Ibe) amounts to 9.1, compared to V = 4.6 for π Aqr (B1Ve), RY Sct is located at least a factor of 10 farther away than π Aqr. All other parameters being equal, the bow shock of RY Sct would thus only extend up to 15″ from the star, and would not be resolved by WISE. This conclusion is supported by Fig. 8, which reveals that the Be stars with a detected bow shock are the nearest and the warmest in the sample.
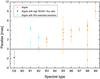 |
Fig. 8 Distance distribution of Algols earlier than spectral type A. Orange squares are Algols without detection of CSM, cyan squares show those with detected extended emission in the WISE W4 band, and black squares those with W4/W1 flux ratios falling above the black-body line (according to Fig. 13 of D15). |
The second Be star with extended emission that we did not include in this study is the B2Vne star V696 Mon. The WISE W4 image is depicted in the upper panel of Fig. 9 and shows a peculiar morphology around the star. The extended emission reaches north of V696 Mon and seems to engulf the star BD -06°1393 located 148″ from V696 Mon at PA = 8°. This association is probably not real, since the Tycho-1 parallaxes of the two stars are quite different. Although the space velocity of V696 Mon [v∗ ,LSR = (15.8 ± 6.2) km s-1] is comparable to the three stars studied here and the IR emission seems to be aligned with the direction of the space motion, the upstream structure does not resemble a bow shock.
We also note that the surrounding ISM of V696 Mon is extremely rich (the star-forming region Monoceros R2 is 56′ away) as seen in the IRAS 100 μm image (lower panel of Fig. 9), and it is difficult to conclude whether the WISE 22 μm emission originates from CSM or ISM.
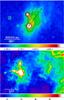 |
Fig. 9 Upper panel: WISE W4 image of V696 Mon at 22 μm. The continuous black arrow gives the uncorrected proper motion from the reprocessed Hipparcos catalogue (van Leeuwen 2007), while the dashed arrow points to the direction of the space motion corrected from the solar motion (Coşkunoǧlu et al. 2011). The colour bar values are given in Jy pix-1. Lower panel: IRAS 100 μm image of the surroundings of V696 Mon (marked as an X). The colour bar values are given in MJy sr-1. |
4. Conclusion
We studied a sample of 70 Algol and Algol-like Be systems with entries in the WISE catalogue4 with the aim of identifying those Algol systems surrounded by dust left over by systemic mass loss. In D15, the two objects, CZ Vel and SX Aur, were discussed, and here we find that three new objects, CX Dra, π Aqr, and ϕ Per, show CSM in the WISE W4 band at 22 μm; π Aqr and CX Dra also show material in WISE W3 at 12 μm. The two objects π Aqr and ϕ Per show clear evidence of an interaction of CSM with the ISM. For these events, we used the distance of the star to the bow shock to derive the mass-loss rate of the matter that escapes from the system. For both systems we estimate a mass-loss rate of ≈10-9 M⊙ yr-1, which is comparable to the mass-loss rate found for single B-type stars and much lower than the predicted systemic mass-loss rate from the hotspot scenario (~10-5 M⊙ yr-1, van Rensbergen et al. 2011; Deschamps et al. 2013, 2015). Incidentally, several bow shocks have been reported around single Be stars by e.g. Kobulnicky et al. (2012), Peri et al. (2012, 2015), and Noriega-Crespo et al. (1997). It seems most likely, therefore, that the bow shocks reported here are unrelated to the binary nature of the considered Be stars, and are of the same origin as those observed among non-binary Be stars. However, this does not entirely exclude the existence of systemic mass loss in these systems. It could well be that the mass transfer episode has already come to an end and the systemic mass-loss rate has dropped.
Therefore, the prospects of finding observational support for systemic mass loss in Algols seem dark. Of the initial sample of 70 targets, only a handful of stars appear to exhibit IR excesses (see Figs. 1–5 and Figs. 13, 14 of D15). It is conceivable that the simulations of D15 overestimate the amount of dust that survives the hotspot mechanism. For the two stars that show the presence of CSM expressed by a bow shock (π Aqr and ϕ Per), neither shock appears to be tied to systemic mass loss.
In the case of CX Dra, we were not able to identify the shaping mechanism responsible for the asymmetric CSE. Both common triggers for asymmetries, ISM interaction forming a bow shock and binary interaction forming an Archimedean spiral, can
be excluded for various reasons. We note therefore that this system is an interesting case for further observations since it may be a case where mass lost from the system is visible in the circumstellar environment.
For an extensive explanation of the hotspot mechanism, see van Rensbergen et al. (2011) and Deschamps et al. (2013, 2015).
The IRSA:WISE archive can be found at http://irsa.ipac.caltech.edu/applications/wise/
The list of objects can be found in Appendix A.
We checked the Herschel Science Archive as well, but only 2 of the 70 targets had been observed by the Herschel Space Observatory, neither of which showed CSE.
Acknowledgments
We want to thank the anonymous referee for the constructive and helpful remarks. This research is supported by the Belgian Federal Science Policy office via the PRODEX Program of ESA. A.M. acknowledges funding by the Austrian Science Fund FWF under project numbers P23586 and P23006-N16 and by the Austrian Research Promotion Agency FFG under project number FA 538019. R.D. acknowledges support from the Communauté française de Belgique – Actions de Recherche Concertées and benefits from a European Southern Observatory studentship. We made use of the NASA/IPAC Infrared Science Archive, which is operated by the Jet Propulsion Laboratory, California Institute of Technology, under contract with the National Aeronautics and Space Administration and of the SIMBAD database, operated at CDS, Strasbourg, France.
References
- Baranov, V. B., Krasnobaev, K. V., & Kulikovskii, A. G. 1971, Sov. Phys. Doklady, 15, 791 [Google Scholar]
- Berdyugin, A., & Piirola, V. 2002, A&A, 394, 181 [NASA ADS] [CrossRef] [EDP Sciences] [Google Scholar]
- Bjorkman, K. S., Miroshnichenko, A. S., McDavid, D., & Pogrosheva, T. M. 2002, ApJ, 573, 812 [NASA ADS] [CrossRef] [Google Scholar]
- Brancewicz, H. K., & Dworak, T. Z. 1980, Acta Astron., 30, 501 [Google Scholar]
- Budding, E., Erdem, A., Çiçek, C., et al. 2004, A&A, 417, 263 [NASA ADS] [CrossRef] [EDP Sciences] [Google Scholar]
- Chaubey, U. S. 1979, Ap&SS, 64, 177 [NASA ADS] [CrossRef] [Google Scholar]
- Coşkunoǧlu, B., Ak, S., Bilir, S., et al. 2011, MNRAS, 412, 1237 [NASA ADS] [Google Scholar]
- Collins, II, G. W. 1987, in Physics of Be Stars, eds. A. Slettebak, & T. P. Snow, IAU Colloq., 92, 3 [Google Scholar]
- Comeron, F., & Kaper, L. 1998, A&A, 338, 273 [NASA ADS] [Google Scholar]
- Cox, N. L. J., Kerschbaum, F., van Marle, A.-J., et al. 2012, A&A, 537, A35 [NASA ADS] [CrossRef] [EDP Sciences] [Google Scholar]
- Crawford, J. A. 1955, ApJ, 121, 71 [NASA ADS] [CrossRef] [Google Scholar]
- de Bruijne, J. H. J., & Eilers, A.-C. 2012, A&A, 546, A61 [NASA ADS] [CrossRef] [EDP Sciences] [Google Scholar]
- Dehnen, W., & Binney, J. J. 1998, MNRAS, 298, 387 [NASA ADS] [CrossRef] [Google Scholar]
- Deschamps, R., Siess, L., Davis, P. J., & Jorissen, A. 2013, A&A, 557, A40 [NASA ADS] [CrossRef] [EDP Sciences] [Google Scholar]
- Deschamps, R., Braun, K., Jorissen, A., et al. 2015, A&A, 577, A55 [NASA ADS] [CrossRef] [EDP Sciences] [Google Scholar]
- Draine, B. T. 1981, ApJ, 245, 880 [NASA ADS] [CrossRef] [Google Scholar]
- Draine, B. T. 1985, ApJS, 57, 587 [NASA ADS] [CrossRef] [Google Scholar]
- Dunstall, P. R., Fraser, M., Clark, J. S., et al. 2012, A&A, 542, A50 [NASA ADS] [CrossRef] [EDP Sciences] [Google Scholar]
- Gies, D. R., Bagnuolo, Jr., W. G.,Ferrara, E. C., et al. 1998, ApJ, 493, 440 [NASA ADS] [CrossRef] [Google Scholar]
- Hanuschik, R. W., Hummel, W., Sutorius, E., Dietle, O., & Thimm, G. 1996, A&AS, 116, 309 [NASA ADS] [CrossRef] [EDP Sciences] [Google Scholar]
- Harmanec, P. 2001, Publications of the Astronomical Institute of the Czechoslovak Academy of Sciences, 89, 9 [Google Scholar]
- Hummel, W., & Štefl, S. 2001, A&A, 368, 471 [NASA ADS] [CrossRef] [EDP Sciences] [Google Scholar]
- Johnson, D. R. H., & Soderblom, D. R. 1987, AJ, 93, 864 [NASA ADS] [CrossRef] [Google Scholar]
- Jorissen, A., Mayer, A., van Eck, S., et al. 2011, A&A, 532, A135 [NASA ADS] [CrossRef] [EDP Sciences] [Google Scholar]
- Kobulnicky, H. A., Lundquist, M. J., Bhattacharjee, A., & Kerton, C. R. 2012, AJ, 143, 71 [NASA ADS] [CrossRef] [Google Scholar]
- Lamers, H. J. G. L. M., Zickgraf, F.-J., de Winter, D., Houziaux, L., & Zorec, J. 1998, A&A, 340, 117 [NASA ADS] [Google Scholar]
- Linnell, A. P., Peters, G. J., & Polidan, R. S. 1988, ApJ, 327, 265 [NASA ADS] [CrossRef] [Google Scholar]
- Maercker, M., Mohamed, S., Vlemmings, W. H. T., et al. 2012, Nature, 490, 232 [NASA ADS] [CrossRef] [PubMed] [Google Scholar]
- Mastrodemos, N., & Morris, M. 1999, ApJ, 523, 357 [NASA ADS] [CrossRef] [Google Scholar]
- Mayer, A., Jorissen, A., Kerschbaum, F., et al. 2011, A&A, 531, L4 [NASA ADS] [CrossRef] [EDP Sciences] [Google Scholar]
- Mihalas, D., & Binney, J. 1981, Science, 214, 823 [NASA ADS] [CrossRef] [Google Scholar]
- Noriega-Crespo, A., van Buren, D., & Dgani, R. 1997, AJ, 113, 780 [NASA ADS] [CrossRef] [Google Scholar]
- Peri, C. S., Benaglia, P., Brookes, D. P., Stevens, I. R., & Isequilla, N. L. 2012, A&A, 538, A108 [NASA ADS] [CrossRef] [EDP Sciences] [Google Scholar]
- Peri, C. S., Benaglia, P., & Isequilla, N. L. 2015, A&A, 578, A45 [NASA ADS] [CrossRef] [EDP Sciences] [Google Scholar]
- Porter, J. M., & Rivinius, T. 2003, PASP, 115, 1153 [NASA ADS] [CrossRef] [Google Scholar]
- Sarna, M. J. 1993, MNRAS, 262, 534 [NASA ADS] [CrossRef] [Google Scholar]
- Snow, Jr., T. P. 1981, ApJ, 251, 139 [NASA ADS] [CrossRef] [Google Scholar]
- Ueta, T., Speck, A. K., Stencel, R. E., et al. 2006, ApJ, 648, L39 [NASA ADS] [CrossRef] [Google Scholar]
- van Buren, D., & McCray, R. 1988, ApJ, 329, L93 [NASA ADS] [CrossRef] [Google Scholar]
- van Leeuwen, F. 2007, A&A, 474, 653 [NASA ADS] [CrossRef] [EDP Sciences] [Google Scholar]
- van Rensbergen, W., de Greve, J. P., Mennekens, N., Jansen, K., & de Loore, C. 2011, A&A, 528, A16 [NASA ADS] [CrossRef] [EDP Sciences] [Google Scholar]
- Weaver, R., McCray, R., Castor, J., Shapiro, P., & Moore, R. 1977, ApJ, 218, 377 [NASA ADS] [CrossRef] [Google Scholar]
- Wilkin, F. P. 1996, ApJ, 459, L31 [NASA ADS] [CrossRef] [Google Scholar]
- Wright, E. L., Eisenhardt, P. R. M., Mainzer, A. K., et al. 2010, AJ, 140, 1868 [NASA ADS] [CrossRef] [Google Scholar]
- Zharikov, S. V., Miroshnichenko, A. S., Pollmann, E., et al. 2013, A&A, 560, A30 [NASA ADS] [CrossRef] [EDP Sciences] [Google Scholar]
Appendix A: List of objects
Seventy Algols and Algol-like Be stars with a WISE source counterpart sorted by declination.
All Tables
Seventy Algols and Algol-like Be stars with a WISE source counterpart sorted by declination.
All Figures
|
Fig. 1 Upper panel: WISE W4 image of CX Dra at 22 μm. The continuous black arrow gives the uncorrected proper motion from the reprocessed Hipparcos catalogue (van Leeuwen 2007), while the dashed arrow points to the direction of the space motion corrected from the solar motion (Coşkunoǧlu et al. 2011). The values of the motion are given in Table 1. The values of the colour bar are given in Jy pix-1. Lower panel: Integrated intensity cut through a wedge covering position angles (PA): 45°–135°. |
| In the text | |
|
Fig. 2 Upper panel: WISE W3 images of CX Dra at 12 μm. Lower panel: integrated intensity cuts through a wedge covering PA: 30°–65° (black line) where emission is visible and PA: 210°–245° (red line) without extended emission. We had to choose smaller wedges to avoid the flux being dominated by the diffraction spikes of the PSF. |
| In the text | |
|
Fig. 3 Same as Fig. 1 for π Aqr. The integrated intensity cut in the lower panel covers PA: 45°–135°. |
| In the text | |
|
Fig. 4 Same as Fig. 2 for π Aqr at 12 μm. The integrated intensity cuts in the lower panel cover PA: 30°–65° (black line) where emission is visible and PA: 210°–245° (red line) without extended emission. |
| In the text | |
|
Fig. 5 Same as Fig. 1 for ϕ Per. The integrated intensity cut in the lower panel covers PA: 80°–165°. The peaks at distances of about 223″ and 283″ in the lower panel correspond to the stars visible in the image at position angles of 99° and 164°, respectively. |
| In the text | |
|
Fig. 6 Density plot relating the mass-loss rate and wind velocity of π Aqr to the bow-shock stand-off distance R0. The colours indicate the difference in au to the measured R0 = 36 000 au. |
| In the text | |
|
Fig. 7 Distribution of Algols among early spectral types (orange bars), along with those with detected extended emission in the WISE W4 band (cyan bars) and with W4/W1 flux ratios falling above the black-body line (black bars). |
| In the text | |
|
Fig. 8 Distance distribution of Algols earlier than spectral type A. Orange squares are Algols without detection of CSM, cyan squares show those with detected extended emission in the WISE W4 band, and black squares those with W4/W1 flux ratios falling above the black-body line (according to Fig. 13 of D15). |
| In the text | |
|
Fig. 9 Upper panel: WISE W4 image of V696 Mon at 22 μm. The continuous black arrow gives the uncorrected proper motion from the reprocessed Hipparcos catalogue (van Leeuwen 2007), while the dashed arrow points to the direction of the space motion corrected from the solar motion (Coşkunoǧlu et al. 2011). The colour bar values are given in Jy pix-1. Lower panel: IRAS 100 μm image of the surroundings of V696 Mon (marked as an X). The colour bar values are given in MJy sr-1. |
| In the text | |
Current usage metrics show cumulative count of Article Views (full-text article views including HTML views, PDF and ePub downloads, according to the available data) and Abstracts Views on Vision4Press platform.
Data correspond to usage on the plateform after 2015. The current usage metrics is available 48-96 hours after online publication and is updated daily on week days.
Initial download of the metrics may take a while.