Free Access
Fig. 6
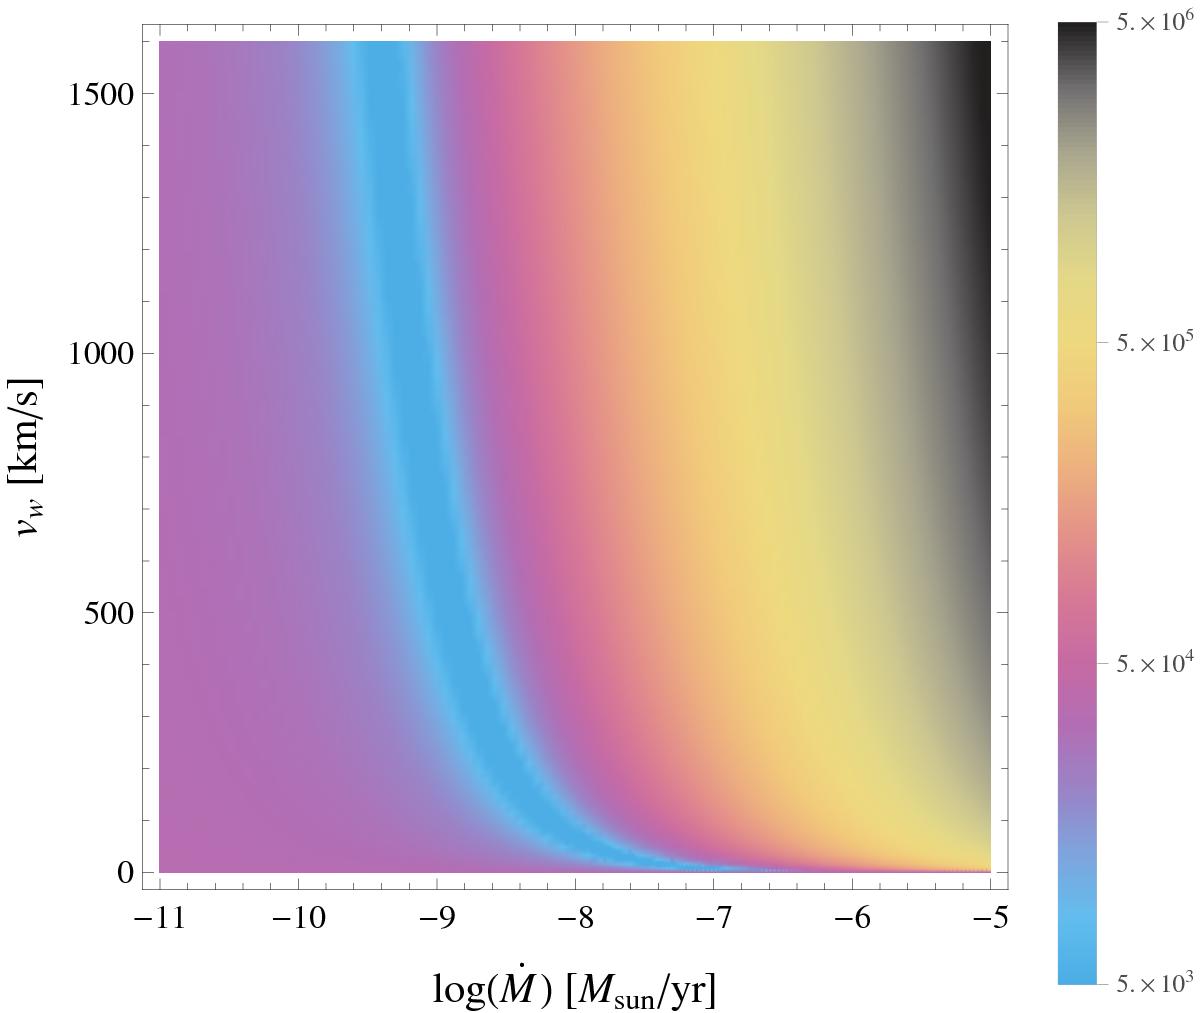
Density plot relating the mass-loss rate and wind velocity of π Aqr to the bow-shock stand-off distance R0. The colours indicate the difference in au to the measured R0 = 36 000 au.
Current usage metrics show cumulative count of Article Views (full-text article views including HTML views, PDF and ePub downloads, according to the available data) and Abstracts Views on Vision4Press platform.
Data correspond to usage on the plateform after 2015. The current usage metrics is available 48-96 hours after online publication and is updated daily on week days.
Initial download of the metrics may take a while.