Fig. 1
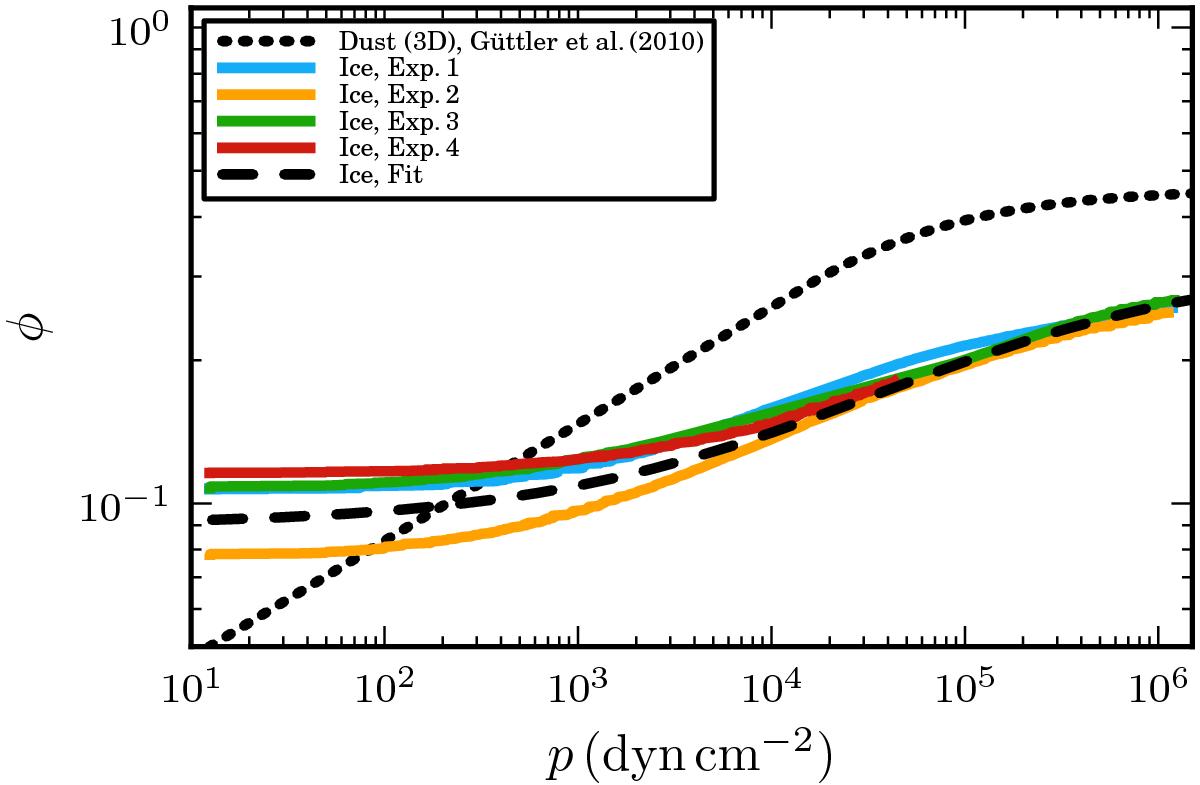
Compression curves of the granular water ice samples consisting of micrometre-sized water ice particles (coloured curves). The initial volume-filling factor of the samples varies between 0.08 and 0.12. The dashed curve shows the best fit to the ice measurements. For comparison, the dotted line is the omnidirectional compression curve for silica particles used in the simulations (Güttler et al. 2009, 2010).
Current usage metrics show cumulative count of Article Views (full-text article views including HTML views, PDF and ePub downloads, according to the available data) and Abstracts Views on Vision4Press platform.
Data correspond to usage on the plateform after 2015. The current usage metrics is available 48-96 hours after online publication and is updated daily on week days.
Initial download of the metrics may take a while.