Fig. 18
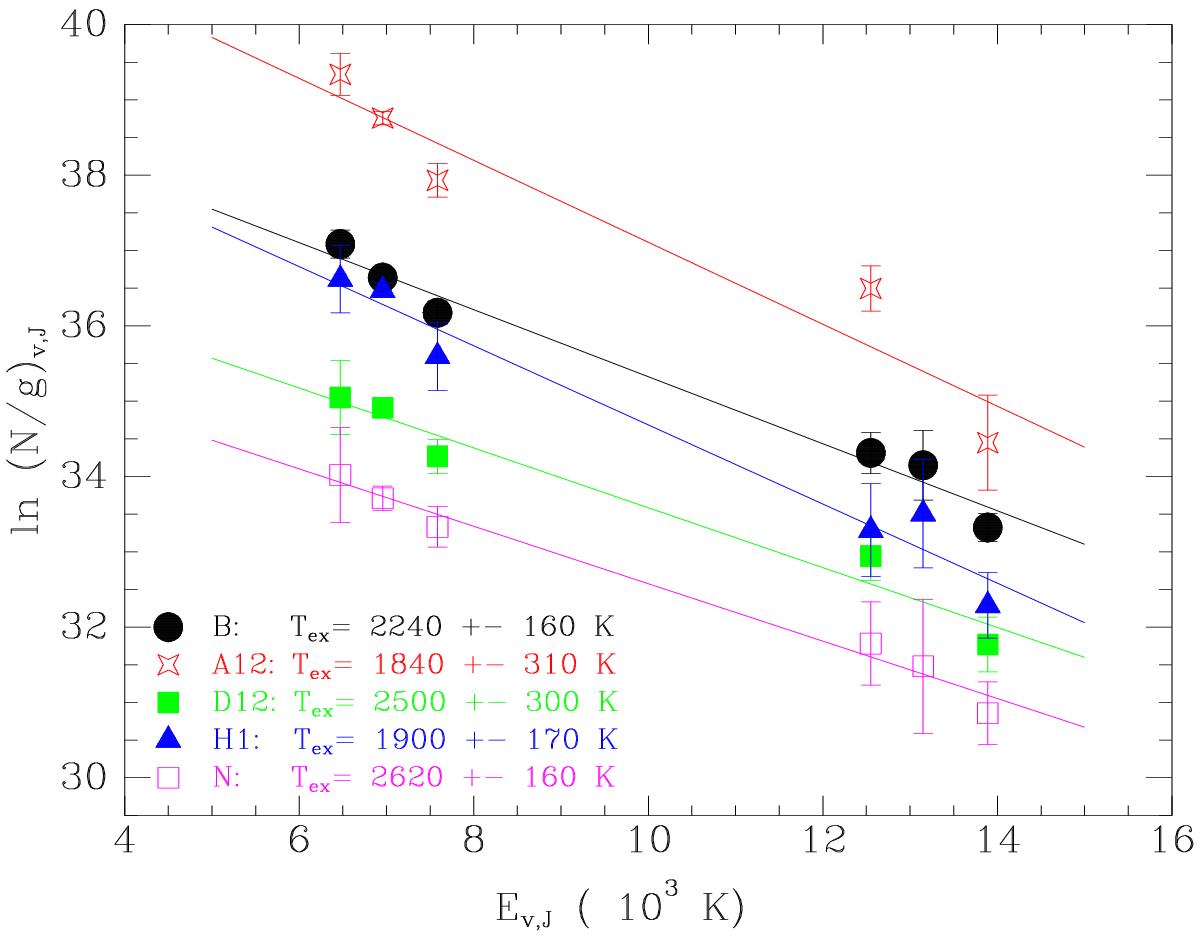
Excitation diagram for the knots listed in Table 7. The entries for each knot are indicated with different symbols and colours and are calculated from the de-reddened line intensities in units of erg s-1 cm-2 sr-1 according to the relation given in the text. Linear fits are made to the points for each knot. Column densities N(v,J) are in the units of cm-2.
Current usage metrics show cumulative count of Article Views (full-text article views including HTML views, PDF and ePub downloads, according to the available data) and Abstracts Views on Vision4Press platform.
Data correspond to usage on the plateform after 2015. The current usage metrics is available 48-96 hours after online publication and is updated daily on week days.
Initial download of the metrics may take a while.