Fig. 14
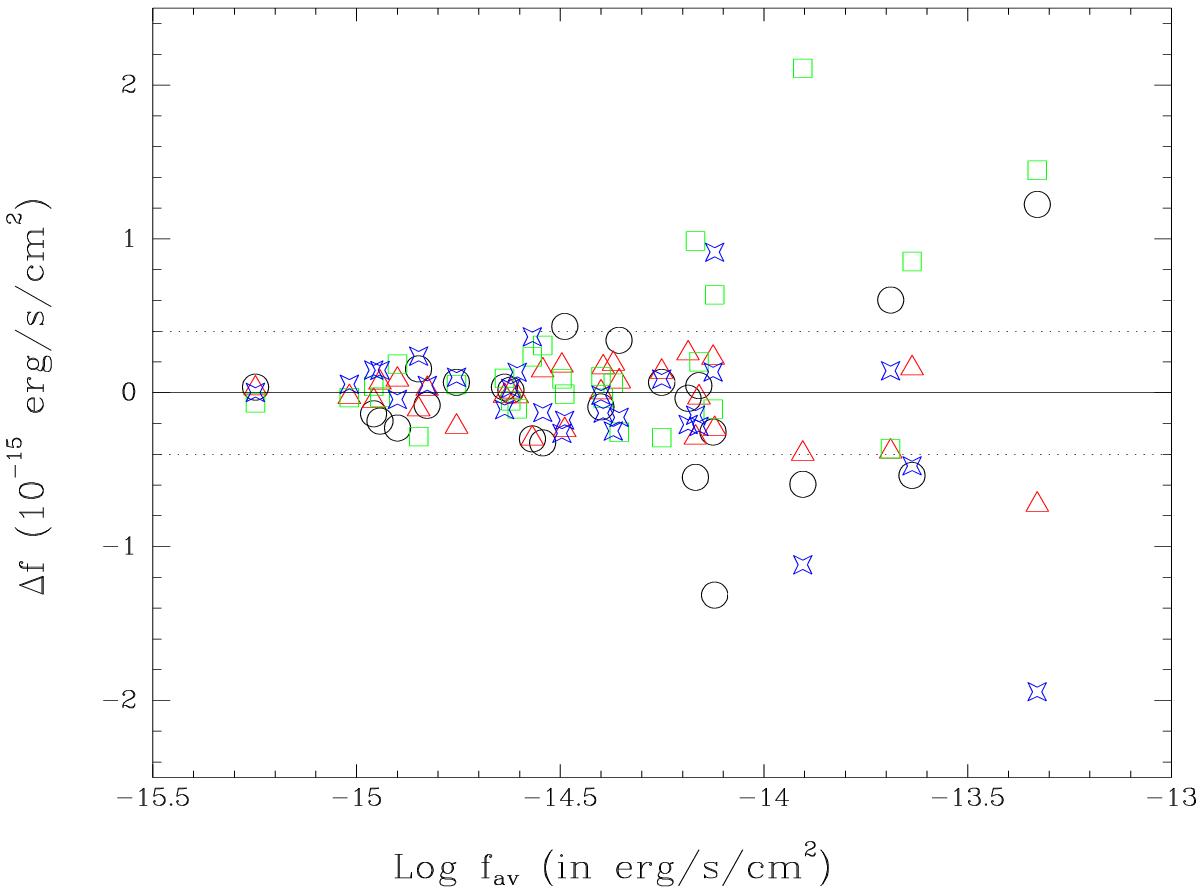
Flux variability detected in 13 of the 29 knots. The deviations from average flux is plotted versus the logarithm of the average flux for each of the knots. Epoch 1 (black circles), epoch 2 (red triangles), epoch 3 (green squares), and epoch 4 (blue stars). Variability is detected whenever the maximum deviation between epochs is greater than 3σ, where σ is the standard deviation of the sky background in the epoch 4 image. The dotted line shows 3σ from average.
Current usage metrics show cumulative count of Article Views (full-text article views including HTML views, PDF and ePub downloads, according to the available data) and Abstracts Views on Vision4Press platform.
Data correspond to usage on the plateform after 2015. The current usage metrics is available 48-96 hours after online publication and is updated daily on week days.
Initial download of the metrics may take a while.