Fig. 13
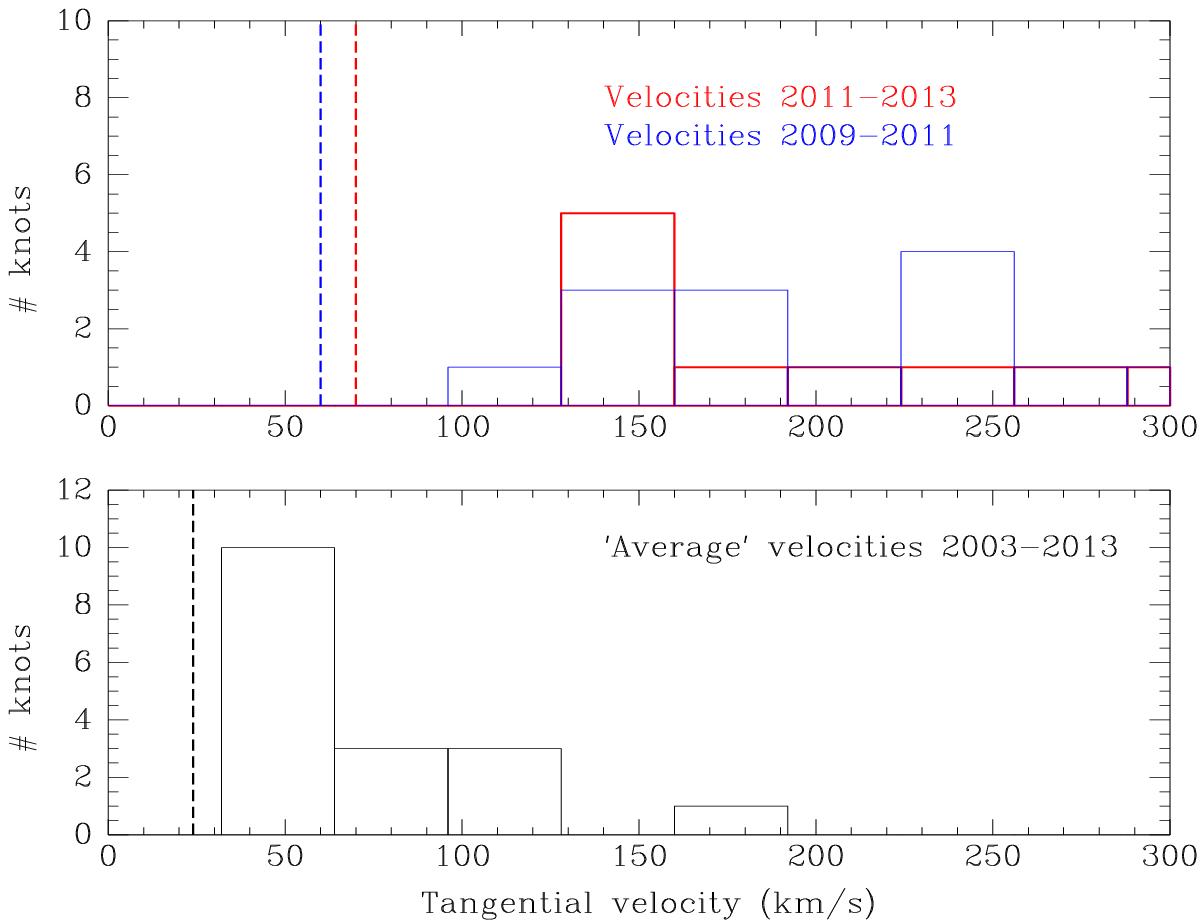
Number distribution of the measured tangential velocities (in km s-1, assuming d = 415 pc). The average velocities over a 10-year timespan from 2003 to 2013 (lower panel) are compared to the more “instantaneous” velocities measured on the shortest timescales of about 2 years (upper panel), the 2011−2013 period (bold red) and the 2009−2011 period (blue). Only knots with proper motion velocities above 2σ (vertical dashed lines) are included.
Current usage metrics show cumulative count of Article Views (full-text article views including HTML views, PDF and ePub downloads, according to the available data) and Abstracts Views on Vision4Press platform.
Data correspond to usage on the plateform after 2015. The current usage metrics is available 48-96 hours after online publication and is updated daily on week days.
Initial download of the metrics may take a while.