Fig. 12
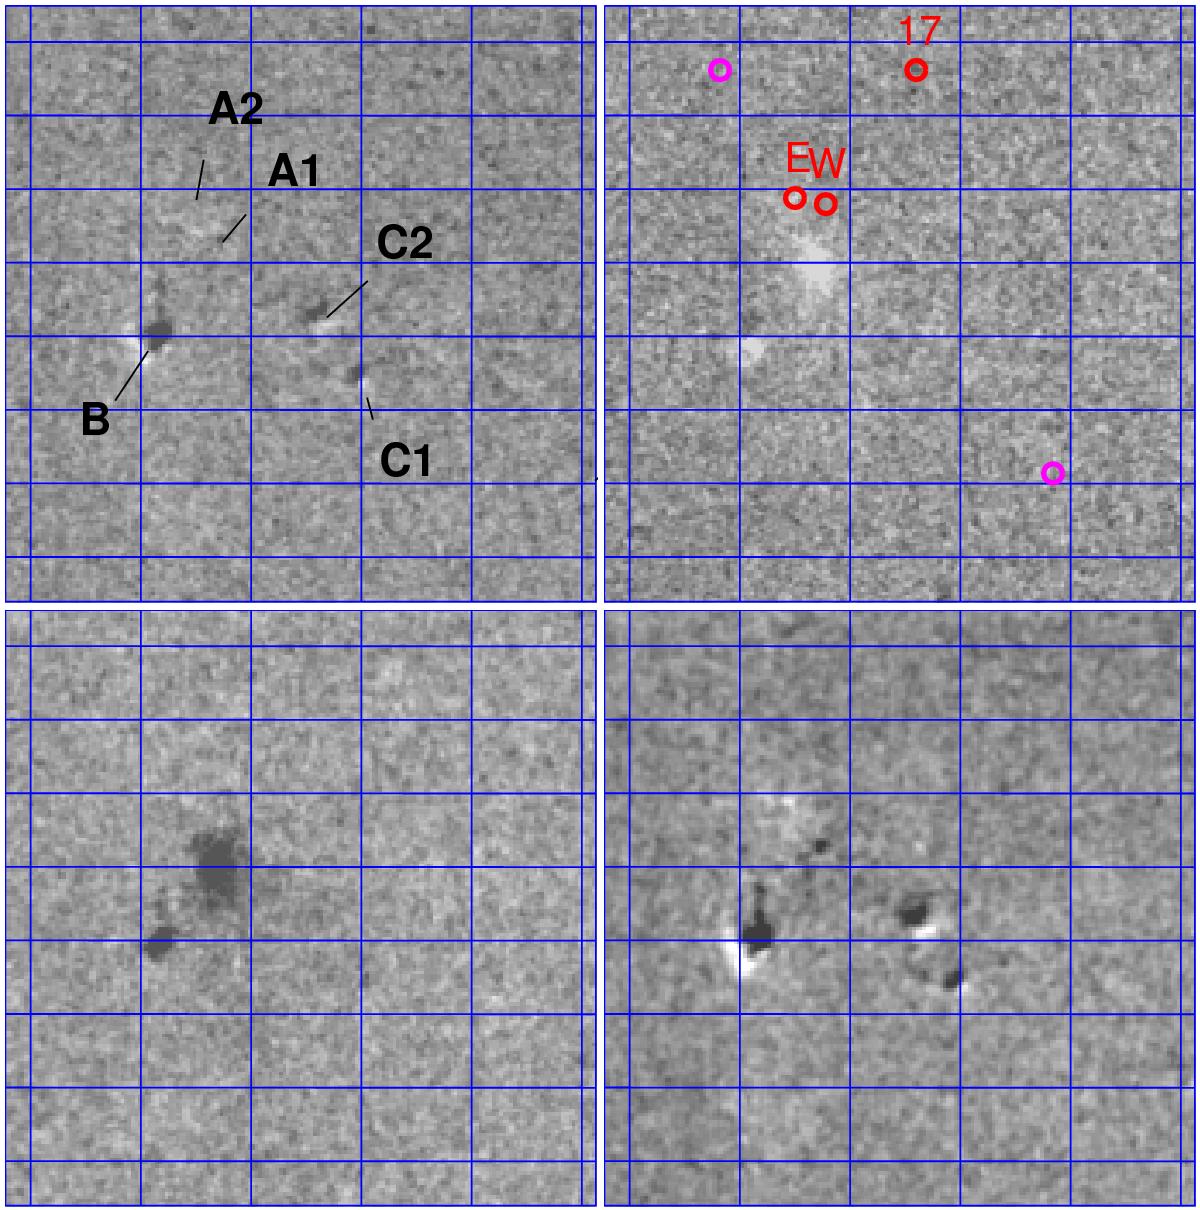
Difference images for part of the MHO 2235 flow including the position of the Class I sources Ser-emb-17 and Ser-emb-11 E and W (red circles) and two YSO candidates from Harvey et al. (2006; magenta circles), cf. Fig. 4. The image shifts are in the direction: ep2-ep1 (upper left), ep3-ep2 (upper right), ep4-ep3 (lower left), and ep4-ep1 (lower right), bright regions showing positive flux. The brightening near knot A1 appeared in the 2011 image and had disappeared again in the 2013 image.
Current usage metrics show cumulative count of Article Views (full-text article views including HTML views, PDF and ePub downloads, according to the available data) and Abstracts Views on Vision4Press platform.
Data correspond to usage on the plateform after 2015. The current usage metrics is available 48-96 hours after online publication and is updated daily on week days.
Initial download of the metrics may take a while.