Fig. 11
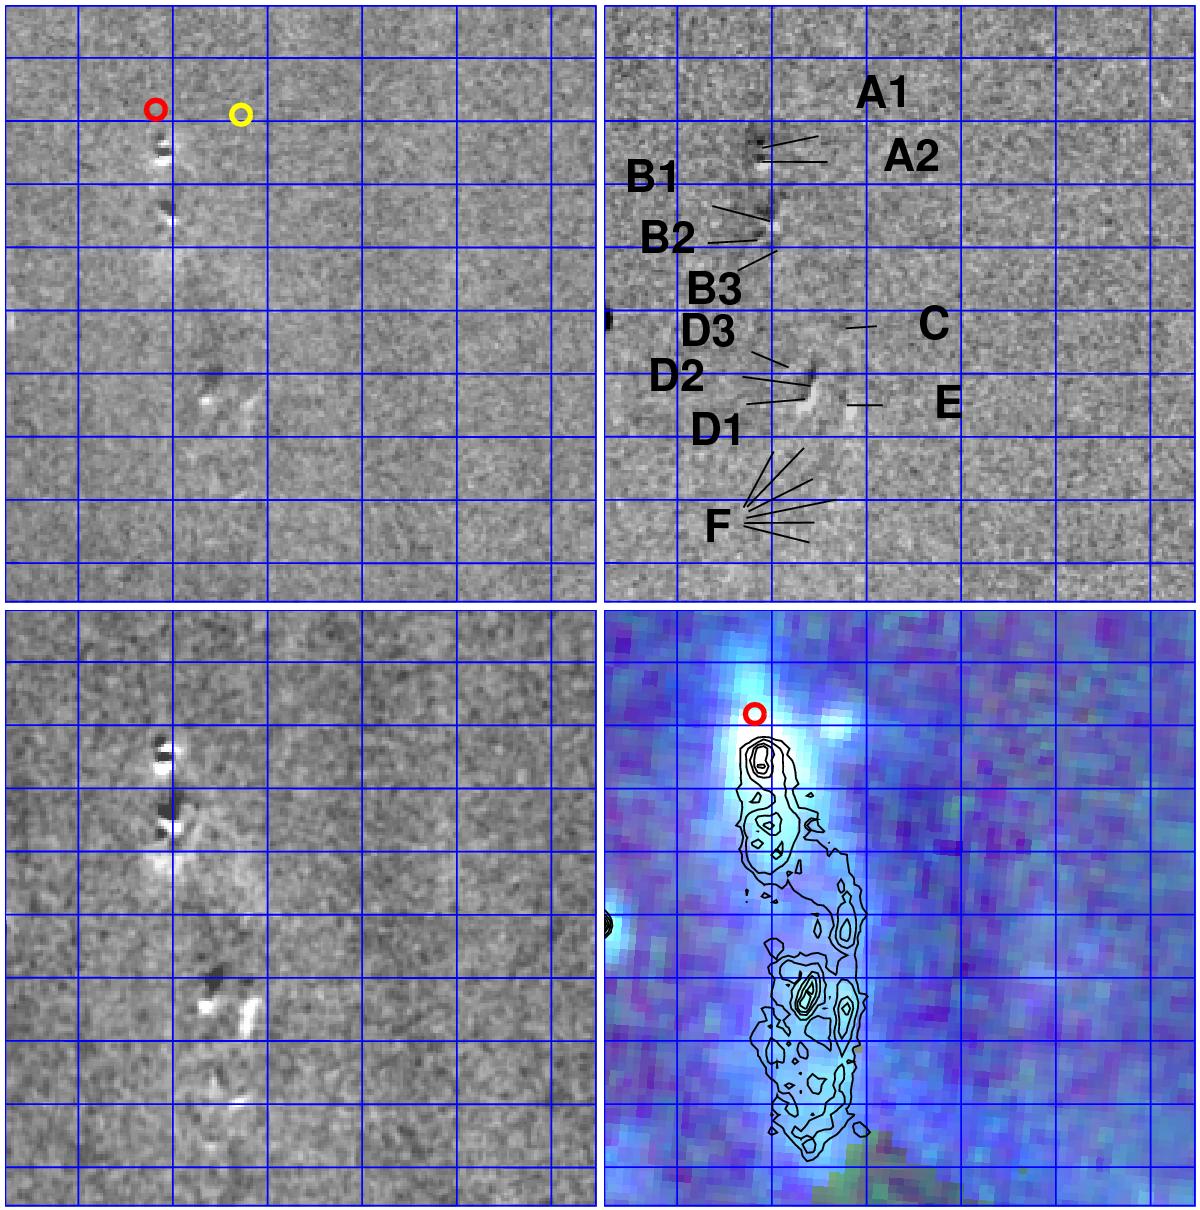
Difference images for part of the MHO 2234 flow including the position of the Class 0 source MMS3 or Ser-emb-1 (red circle) and a not classified YSO from Harvey & Dunham (2009; yellow circle). The image shifts are in the sense: ep2-ep1 (upper left), ep3-ep2 (upper right), and ep4-ep1 (lower left), bright regions showing positive flux. The IRAC/Spitzer 4.5 μm (blue), 5.8 μm (green), and 8 μm (red) is shown with the H2v = 1−0 S(1) line emission in black contours (lower right).
Current usage metrics show cumulative count of Article Views (full-text article views including HTML views, PDF and ePub downloads, according to the available data) and Abstracts Views on Vision4Press platform.
Data correspond to usage on the plateform after 2015. The current usage metrics is available 48-96 hours after online publication and is updated daily on week days.
Initial download of the metrics may take a while.