Fig. 8
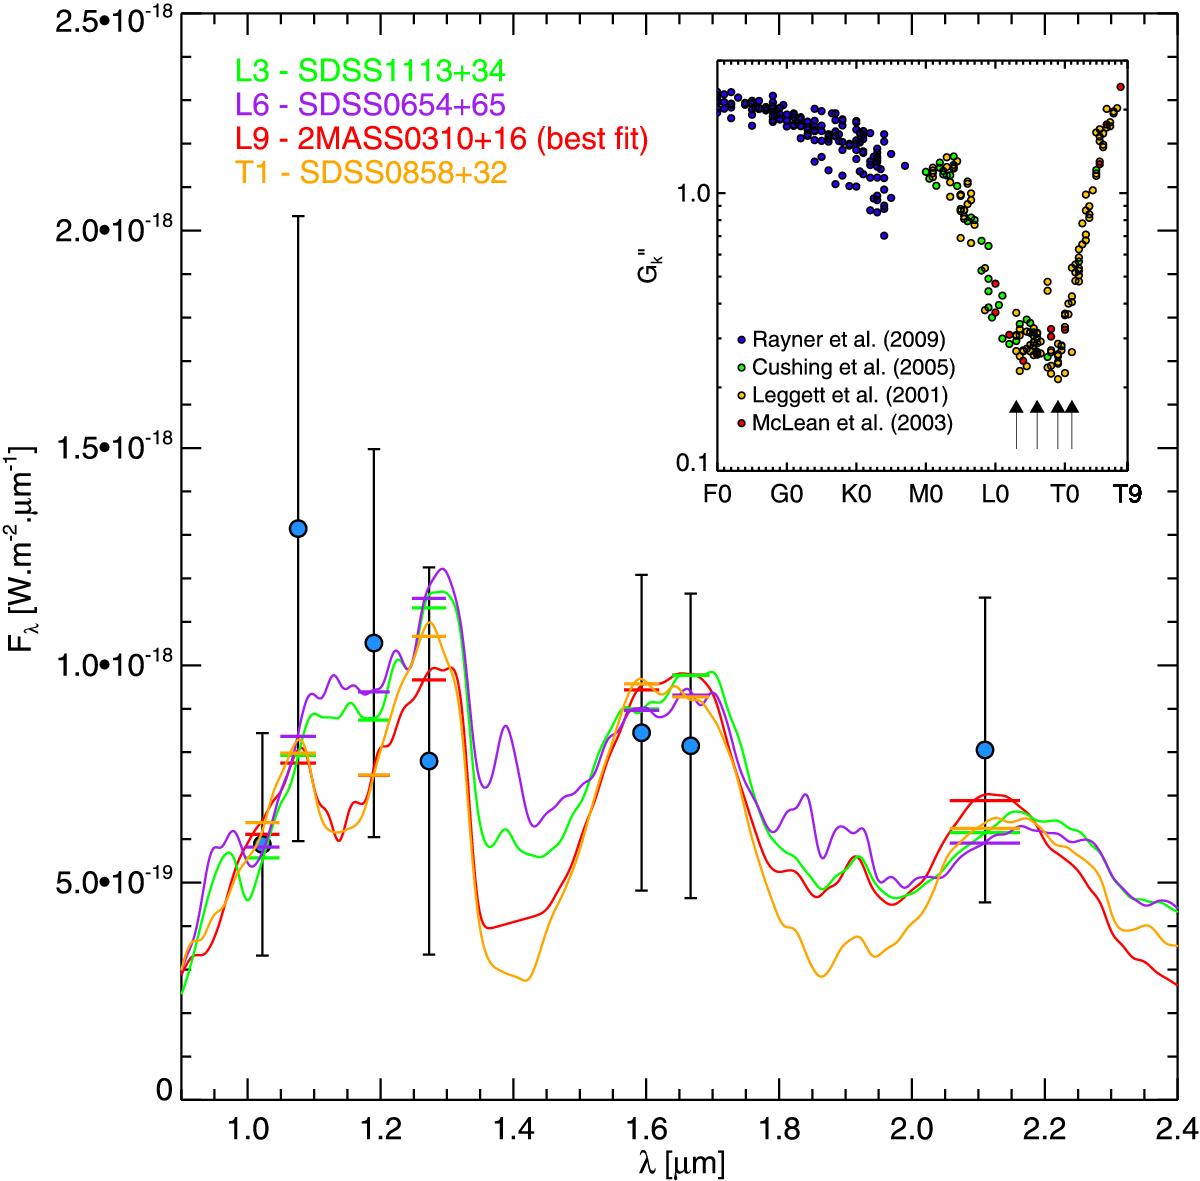
Comparison of the flux of the newly identified candidate (blue circles) with SEDs of different substellar objects of spectral types L3, L6, L9 (best fit), and T1. For each spectral type, we plot the object that provides the best fit according to the ![]() indicator. The inset plot at the top shows the
indicator. The inset plot at the top shows the ![]() values as a function of spectral type for ~400 objects taken from various libraries (Leggett et al. 2001; McLean et al. 2003; Cushing et al. 2005; Rayner et al. 2009). The vertical arrows indicate the spectral type of the plotted SEDs.
values as a function of spectral type for ~400 objects taken from various libraries (Leggett et al. 2001; McLean et al. 2003; Cushing et al. 2005; Rayner et al. 2009). The vertical arrows indicate the spectral type of the plotted SEDs.
Current usage metrics show cumulative count of Article Views (full-text article views including HTML views, PDF and ePub downloads, according to the available data) and Abstracts Views on Vision4Press platform.
Data correspond to usage on the plateform after 2015. The current usage metrics is available 48-96 hours after online publication and is updated daily on week days.
Initial download of the metrics may take a while.