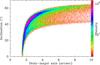
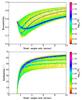
Fig. 14
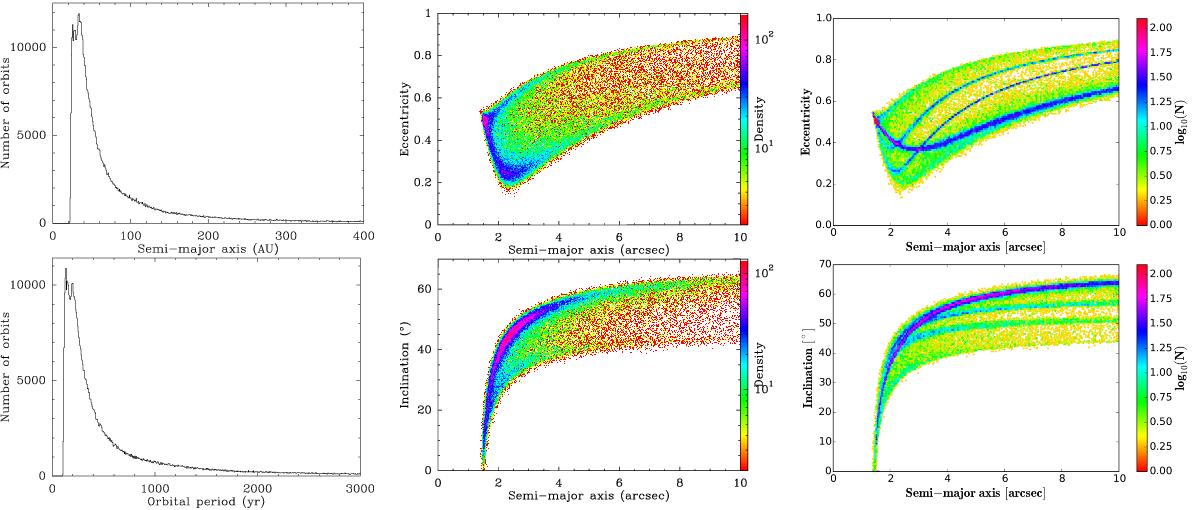
Left and middle: additional plots to Fig. 13 restricted to bound orbits recovered only by our MCMC fit, showing i) posterior distributions of semi-major axis and orbital period (left); ii) bidimensional density maps, involving the semi-major axis a versus the eccentricity e and the inclination i. The color scale appearing to the right of the plots also applies to all similar plots in Fig. 13. Right: the same bidimensional density maps as shown in Fig. 14, showing orbit solutions recovered by our LSMC fit with semi-major axes smaller than 10′′.
Current usage metrics show cumulative count of Article Views (full-text article views including HTML views, PDF and ePub downloads, according to the available data) and Abstracts Views on Vision4Press platform.
Data correspond to usage on the plateform after 2015. The current usage metrics is available 48-96 hours after online publication and is updated daily on week days.
Initial download of the metrics may take a while.