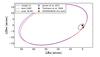
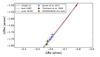
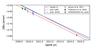
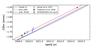
Fig. 10
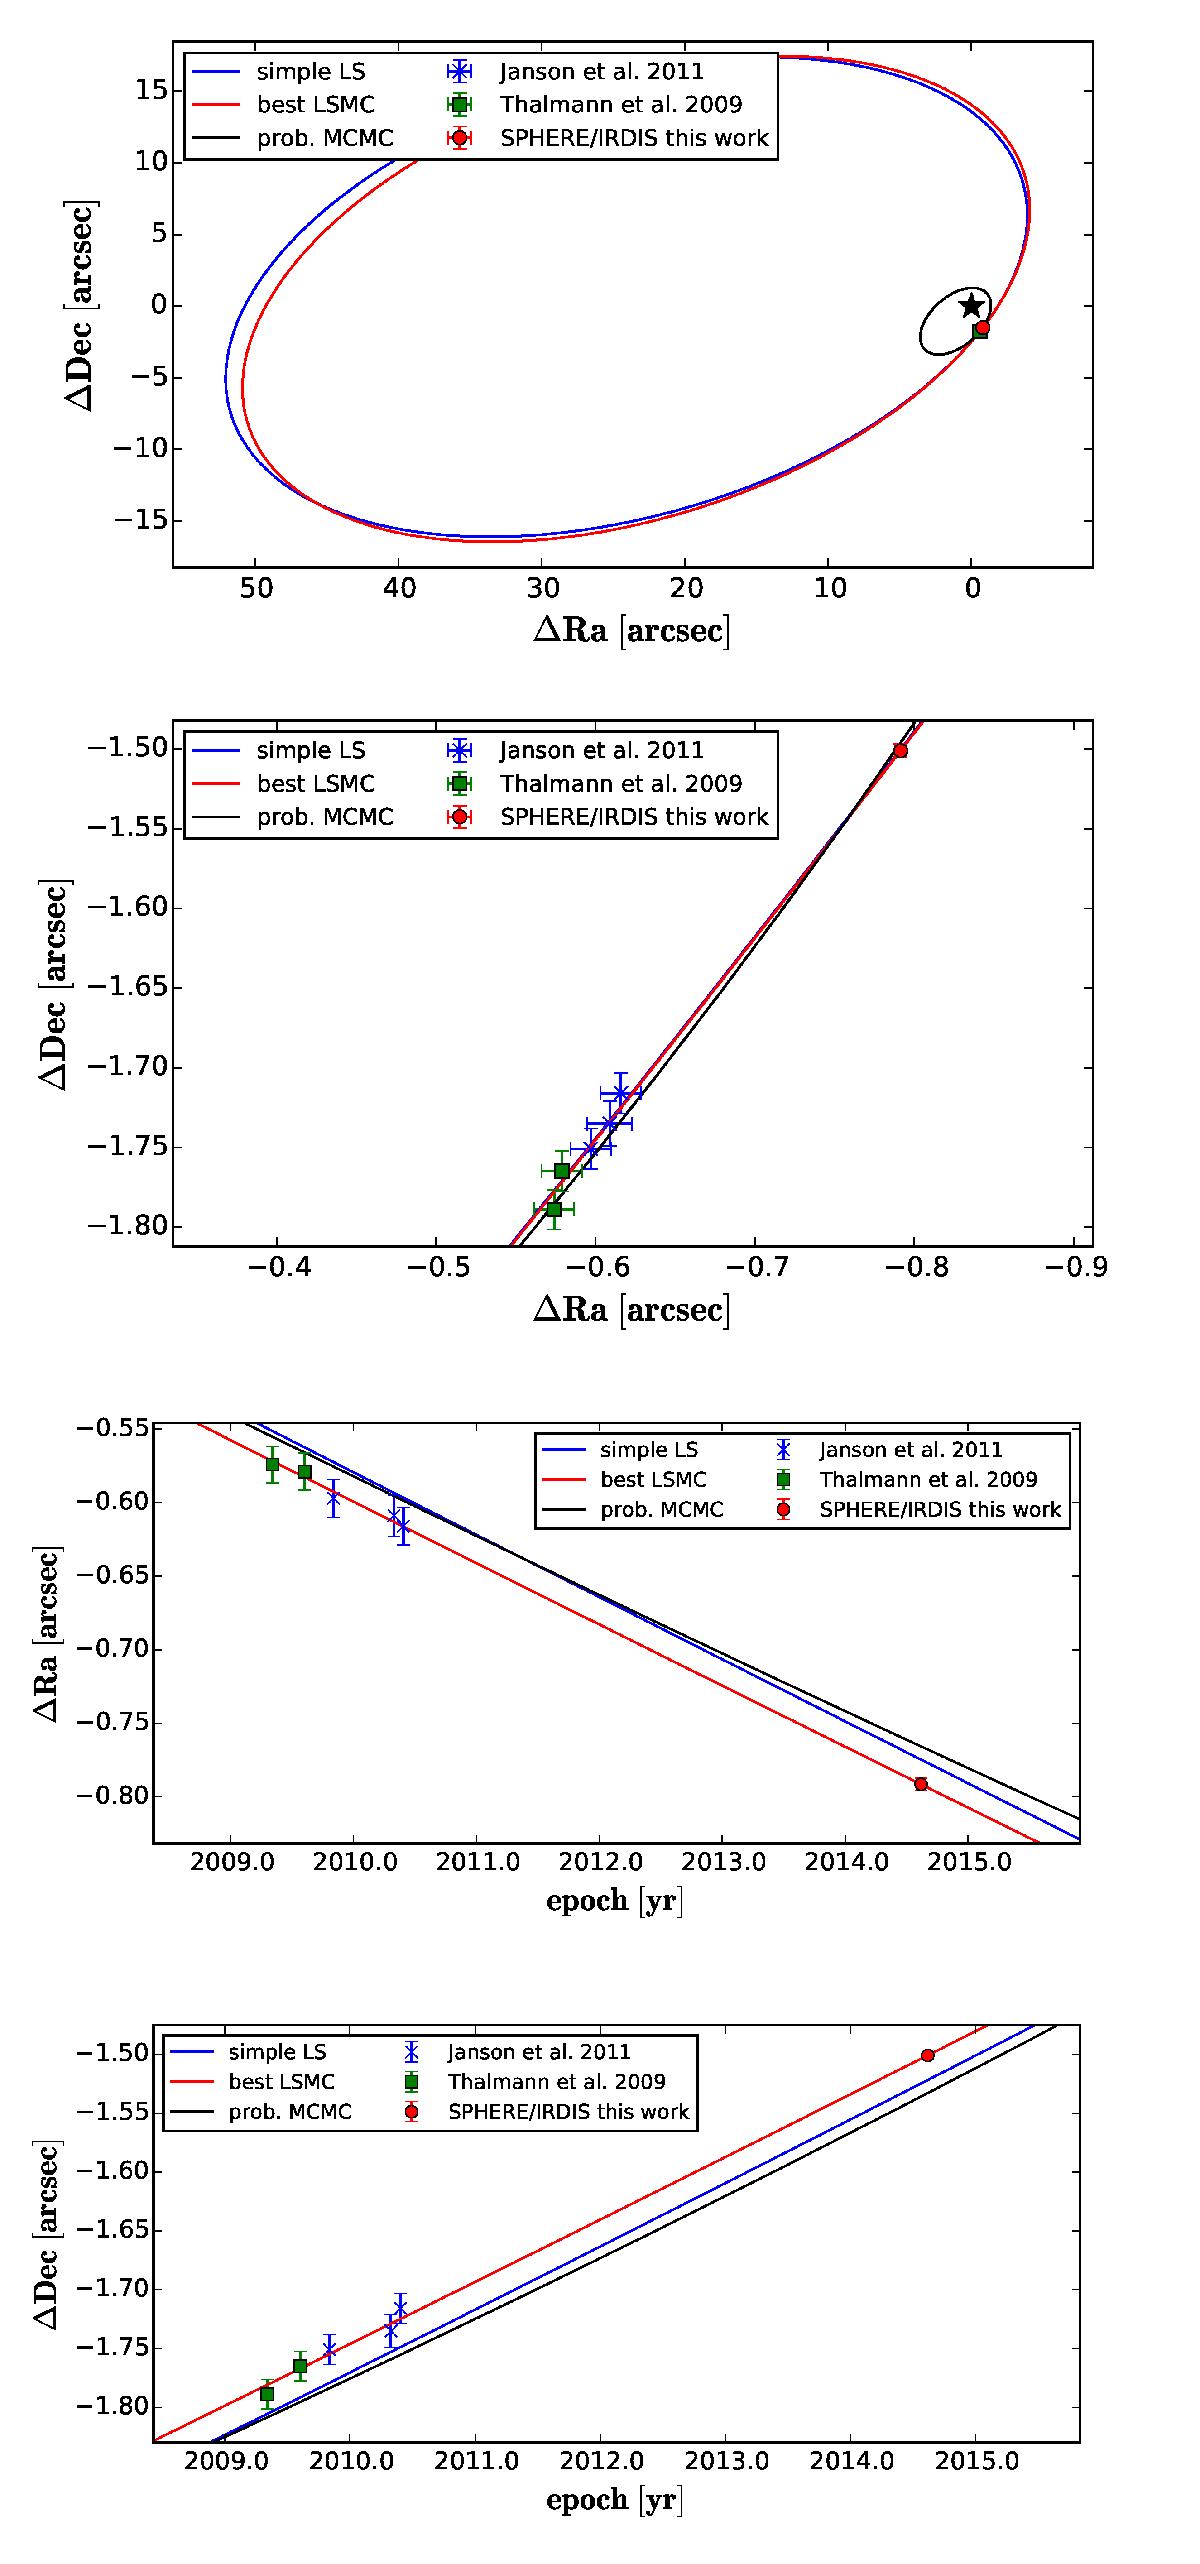
Best-fitting orbits recovered with simple least squares fitting as well as LSMC fitting. In addition, we show a probable orbit with orbital elements close to the peak values, recovered by our MCMC fit (see Sect. 6.2). Solid lines represent the apparent orbits. The corresponding orbital elements are listed in Table 10. We show the data points taken with Subaru/HiCIAO (green squares) as given in Thalmann et al. (2009), as well as the data points taken with Subaru/HiCIAO, Gemini/NIRI and Keck/NIRC2 (blue crosses) given in Janson et al. (2011), together with our SPHERE/IRDIS measurement (red circle).
Current usage metrics show cumulative count of Article Views (full-text article views including HTML views, PDF and ePub downloads, according to the available data) and Abstracts Views on Vision4Press platform.
Data correspond to usage on the plateform after 2015. The current usage metrics is available 48-96 hours after online publication and is updated daily on week days.
Initial download of the metrics may take a while.