Free Access
Fig. D.5
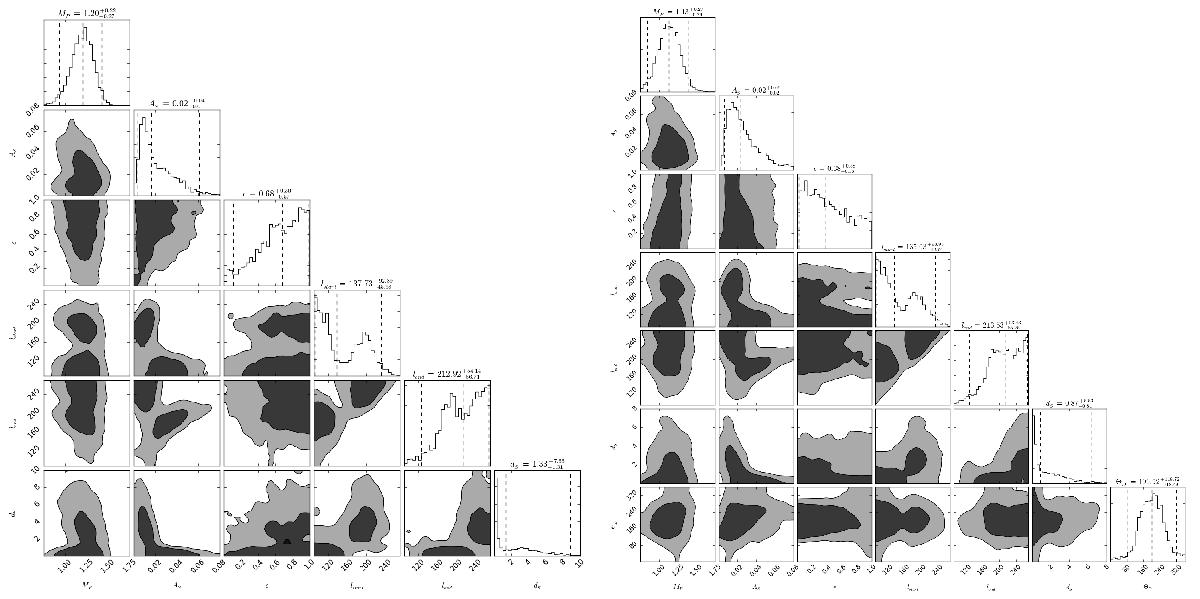
TrES-2b phase curve constraints: posterior projections for the “standard + asy” model (left) and “standard + both” model (right). Dashed vertical lines represent marginalized 95% credibility regions. Smoothed 68% and 95% credibility regions in dark and light gray shade, respectively.
Current usage metrics show cumulative count of Article Views (full-text article views including HTML views, PDF and ePub downloads, according to the available data) and Abstracts Views on Vision4Press platform.
Data correspond to usage on the plateform after 2015. The current usage metrics is available 48-96 hours after online publication and is updated daily on week days.
Initial download of the metrics may take a while.