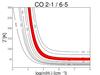
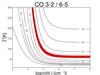
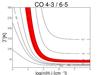
Fig. 7

RADEX diagnostic plots of CO 2–1 (top), 3–2 (middle) and 4–3 (bottom). The derived line ratios of the blue flow of Serpens SMM1 are highlighted in red to serve as an illustration for the sub-thermal and thermal excitation scenarios. It is evident that temperatures below 50 K are excluded in all limits as ratios of CO 2–1 and 3–2 over 6–5 do not agree with those of 4–3.
Current usage metrics show cumulative count of Article Views (full-text article views including HTML views, PDF and ePub downloads, according to the available data) and Abstracts Views on Vision4Press platform.
Data correspond to usage on the plateform after 2015. The current usage metrics is available 48-96 hours after online publication and is updated daily on week days.
Initial download of the metrics may take a while.