Fig. 4
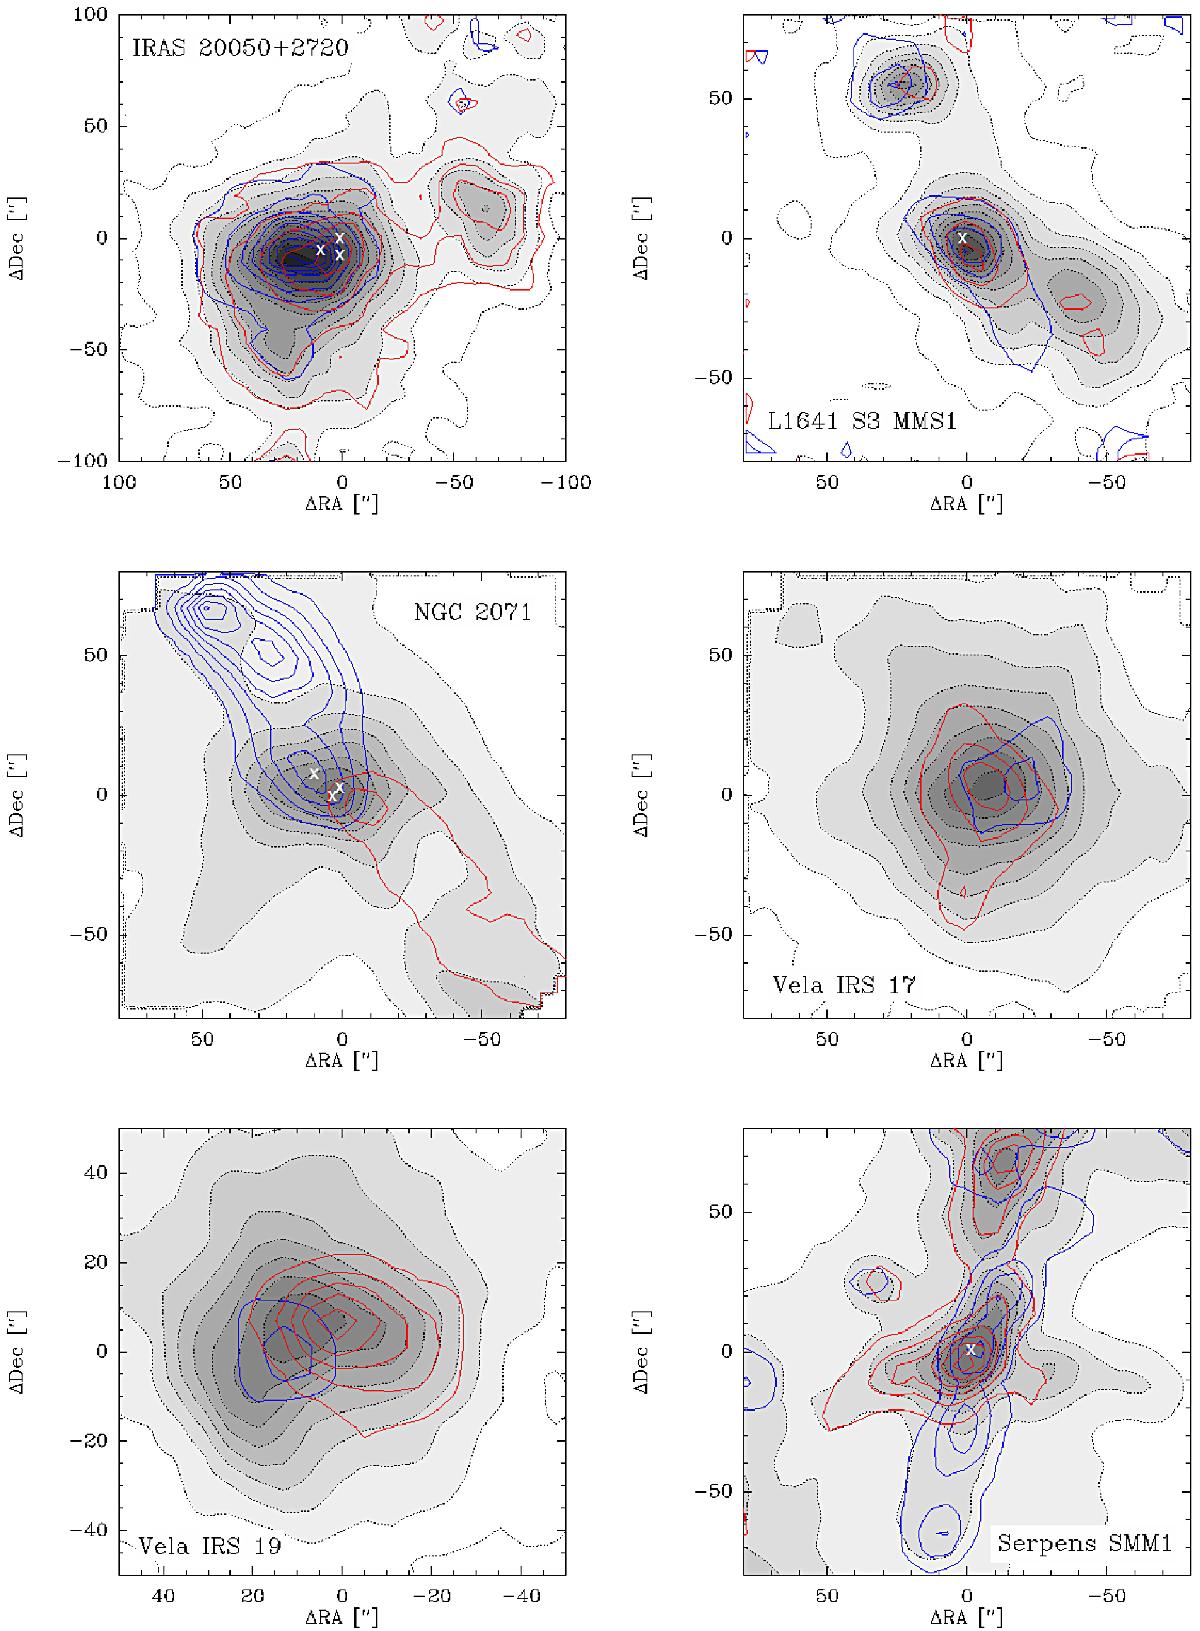
Maps showing the CO J = 6–5 integrated emission in –20 to –4 (blue) and +4 to +20 (red) km s-1 bins to visualize the outflowing gas, overplotted on the integrated emission in a –3 to +3 km s-1 bin (dotted line and grayscale), representing the quiescent emission. All velocities are with respect to the individual source velocity (see Table 1). NGC 2071 was characterized by defining outflow bins at –40 to –10 and +10 to +40 km s-1 instead of the bins above. All contours, including those of the outflowing gas are normalized towards the peak intensity of the quiescent gas component at the central position (Tpeak in Table 2). Levels are in turn given in 10%, 20%, ..., 80%, 90% w.r.t. to this peak intensity. Where known, locations of (sub)millimeter interferometry sources are shown with “×”.
Current usage metrics show cumulative count of Article Views (full-text article views including HTML views, PDF and ePub downloads, according to the available data) and Abstracts Views on Vision4Press platform.
Data correspond to usage on the plateform after 2015. The current usage metrics is available 48-96 hours after online publication and is updated daily on week days.
Initial download of the metrics may take a while.