| Issue |
A&A
Volume 586, February 2016
|
|
|---|---|---|
| Article Number | L6 | |
| Number of page(s) | 4 | |
| Section | Letters | |
| DOI | https://doi.org/10.1051/0004-6361/201527906 | |
| Published online | 01 February 2016 | |
A possible imprint of quasi-periodic oscillations in the X-ray spectra of black hole binaries
1 APC, AstroParticule et Cosmologie, Université Paris Diderot, CNRS/IN2P3, CEA/Irfu, Observatoire de Paris, Sorbonne Paris Cité, 10 rue Alice Domon et Léonie Duquet, 75205 Paris Cedex 13, France
e-mail: This email address is being protected from spambots. You need JavaScript enabled to view it.
2 Laboratoire AIM, CEA/IRFU-CNRS/INSU-Université Paris Diderot, CEA DSM/IRFU/SAp, 91191 Gif-sur-Yvette, France
Received: 7 December 2015
Accepted: 29 December 2015
Abstract
Context. While nobody would deny the presence of quasi-periodic oscillations in the power density spectrum of black hole binaries nor their importance in the understanding of the mechanisms powering the X-ray emissions, the possible impact on the time-averaged disk energy spectrum from the phenomenon responsible for quasi-periodic oscillations is largely ignored in models of sources emission.
Aims. Here we investigate the potential impact of such a structure on the resultant energy spectrum.
Methods. Using data from the well-documented outbursts of XTE J1550-564, we looked at possible hints that the presence of quasi-periodic oscillations actually impacts the energy spectrum emitted by the source. In particular, we look at the evolution of the relation between the inner disk radius and the inner disk temperature obtained from fits to the spectral data. We then test this further by developing a simple model to simulate the spectrum of a disk with a structure mimicking quasi-periodic oscillations that are increasing in strength simulated results to those obtained from real data.
Results. We detect a similar departure in the inner radius – inner temperature curve coming from the standard fit of our simulated observations as is seen in XTE J1550-564 data. We interpret our results as evidence that the structure at the origin of the quasi-periodic oscillations impacts the energy spectrum.
Conclusions. Furthermore, in states with significant disk emission the inaccuracy of the determination of the disk parameters increases with the strength of quasi-periodic oscillations, an increase that then renders the value given by the fit unreliable for strong quasi-periodic oscillations.
Key words: X-rays: binaries / accretion, accretion disks / stars: individual: XTE J1550-564
© ESO, 2016
1. Introduction
When looking at the power density spectrum (PDS) of microquasars the most striking features are the presence of narrow peaks, called quasi-periodic oscillations (QPO). These low-frequency (< 30 Hz, LF) and high-frequency (> 40 Hz, HF) QPOs contain a significant part of the source rapid variability. Some LFQPOs can have an amplitude of up to 30%. Several distinct models exist to describe them, and many imply a warm/hot structure orbiting the disk causing the X-ray modulation. Such structures include tori either axisymmetric (see, e.g., Bursa et al. 2004; Schnittman et al. 2006b; Vincent et al. 2014) or precessing (Schnittman et al. 2006c; Ingram et al. 2009), hotspots (Karas et al. 1992; Schnittman & Bertschinger 2004; Tagger & Varniere 2006; Pechacek et al. 2013), or spirals (Tagger & Pellat 1999; Varniere et al. 2002).
Nevertheless, when analyzing the energy spectra of the sources, the disk is mostly considered as relatively homogeneous with a smooth, monotonic temperature profile. If such a featureless disk may be a good representation for the so-called thermal states during which the energy spectra resemble pure blackbody and the associated PDS show little or no variability with no or weak QPO, this model is not appropriate to describe states with prominent QPOs. Here we aim to explore whether the structure at the origin of QPOs indeed has a measurable impact on the energy spectrum and its fits.
The shape and existence of more than one component in the X-ray spectra makes it hard to look at a direct impact from the structure at the origin of the QPO. Nevertheless, we can look at a possible impact of the presence of QPOs on the spectral fit parameters and the correlations between them. Many correlations between spectral parameters and QPO parameters have been presented (Muno et al. 1999; Remillard et al. 2002; Rodriguez et al. 2002; Vignarca et al. 2003), but not many studies have been carried out to investigate any change in the correlation between spectral parameters depending on the QPO presence.
In Sect. 2 we use data from two outbursts of XTE J1550-564 observed by RXTE, which have the advantage that it is long and well observed, to see if some trends are indeed visible in the correlation between spectral parameters depending on the presence of QPOs. In order to test this idea further, we present in Sect. 3 a simplified model of a disk with an increasingly strong QPO that we then use to compute the source’s energy spectrum. In Sect. 4 we use this model in conjecture with the module fakeit from XSPEC to test the impact on the energy spectrum of a hot structure in the disk. This allows us to directly measure the impact of the QPO as the difference between the model parameters and the resulting fits and to compare those simulated fits results against real correlations.
2. Link between disk parameters and QPOs
It has been asserted early on that the properties of the LFQPOs, and in particular their frequencies, are related to parameters of the disk (Muno et al. 1999; Rodriguez et al. 2002; Vignarca et al. 2003; Varniere et al. 2002) obtained through spectral fitting. As there is much less data for HFQPOs, no similar study has been carried out yet, but HFQPOs seem to be linked with the presence of LFQPOs of type A or B (Remillard et al. 2002). Here we are using data from XTE J1550-564 during the outbursts of 98−99 and 2000, both known to harbor HFQPOs, to see if there is any difference in the behavior of the different spectral parameters, depending on whether or not there is a QPO of any type observed.
2.1. Observations and data reduction
XTE J1554−564 has undergone five different outbursts during the lifetime of RXTE. The last three occurred in 2001, 2002, and 2003 are considered as failed since the source did not show any spectral transition to soft flavored (i.e., disk) states. We therefore consider here only the first two outbursts, which also are the two brightest. They occurred from 1998 Sept. 6, until roughly the beginning of May 1999 for the discovery outburst and from 2000 April 10 to 2000, July 16 for the second and fainter outburst. Both outbursts have been extensively described in the literature (e.g., Sobczak et al. 2000; Remillard et al. 2002; Miller et al. 2001; Rodriguez et al. 2003, 2004). In the following study, we consider only the observations showing the presence of LFQPO and/or HFQPO as reported in these articles. The QPO parameters are taken from Remillard et al. (2002), Miller et al. (2001), Rodriguez et al. (2004). Since the spectral calibration of the Proportional Counter Array (PCA) has significantly evolved since the publication of these articles, we re-reduced and re-analyzed the spectral data to present the most accurate spectral parameters, but we kept the parameters. We kept the distance (D = 6 kpc) and inclination (70°) that were used in these earlier papers to compare with the previous results (e.g., Remillard et al. 2002). The distance and inclination we use are the only scaling factors applied to the radius (see full expression if Eq. (1)). As long as we use the same scaling factors for the observations and simulated observations, we can compare the results.
The PCA data were reduced with the HEASOFT v6.16 suite. Good time intervals were defined as intervals with a satellite elevation angle above the Earth greater than 10°, an offset between the pointing and source direction of less than 0.02°, and recommended limitations on proportional counter units (PCU) potential breakdowns. Spectra were then extracted from the top layer of PCU 2. Background spectra were obtained with the bright background model and generated with pcabackest, while response files were generated through pcarsp. 0.8% systematic errors were added to all spectral channels before fitting.
The PCA spectra were fitted with XSPEC v12.6.2 between 3 and 30 keV. As we were interested in basic parameters, we only considered simple spectral models. All spectra are well represented with an absorbed (phabs) disk (diskbb) plus power-law (powerlaw) model. The value of the high spectral boundary of our fits did not allow us to significantly constrain the potential presence and properties of a reflection bump. Nevertheless, in a few cases we added a Gaussian at 6.5 keV representing fluorescent emission of iron, usually taken as a signature for reflection, to the model to obtain a good fit.The absorption was fixed to NH = 0.8 × 1022 cm-2 (Miller et al. 2003).
The spectral fit provides access to the slope of the power law (i.e., the photon index Γ), its normalization, the temperature of the inner edge of the disk and the disk normalization. The latter is related to the inner apparent disk radius Rin, following Norm = ((Rin/ km)/(D/ (10 kpc)))2cosi, where D is the distance to the source and i the viewing angle of the disk. It is known that the apparent radius relates to the real inner radius through a hardening factor f (Shimura & Takahara 1995). Here we choose to keep that Rin and not add a correction factor, since we are interested in the raw output of the fit that we then intend to compare with our simulated observations.
2.2. Departure from rin-Tin correlation
In Fig. 1 we represent the evolution of the disk parameters rin vs. Tin obtained from the spectral fits to the data.
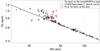 |
Fig. 1 Correlation between the inner edge position and inner edge temperature as directly given by the spectral fits for the outburst of 98−99 and 2000 of XTE J1550-564. Red dots represent observations with HFQPOs detected while the black dots indicate observations with no HFQPO detections. The crosses represent the type of LFQPO, black for the common type C, blue for type B, and red for type A. Timing data from Remillard et al. (2002) and Rodriguez et al. (2002). |
Two behaviors emerge from this plot. At a large radius, the majority of points narrowly follow a power law, while there is an obvious departure as the inner edge of the disk gets smaller than 50 km. This departure occurs when HFQPOs or similarly type A/B LFQPOs are observed1. This departure is always in the same direction, namely, at similar inner radius, we obtain a hotter disk in the case of a detected HFQPO/type A/B LFQPO than in the standard case with a type C (hard state). This may be compatible with the view that HFQPOs are a kind of hot structure in the disk.
At this point, one has to wonder if, as all those data points come from the spectral fitting with a smooth monotonic disk, it is possible that the departure from the correlation could be rooted from the presence of a QPO/warm structure, which causes the fit to fail and gives inaccurate values. To test this assumption, that in the presence of a localized hot structure in the disk spectral fit using a smooth temperature profile yields an inaccurate value, we perform fits of a disk with such structure but in a controlled, hence, simulated manner. We then compare the results of the fit with the real values.
3. Simple model for the temperature profile
The QPO models often connect the signal modulations to the presence of structures embedded in the disk. Our main concern here is not the origin of the structure, but its consequences on the emission and whether this structure ever needs to be taken into account when doing a spectral fit. This means that, rather than taking full magnetohydrodynamic (MHD) simulations of the different models proposed to explain QPOs we are interested in, we decided to create a simple, analytical, model to test its impact in a cleaner and easier way. Indeed, in a full fluid simulation changing one parameter in the initial condition can have repercussions on several observable parameters and, therefore, it is harder to study the different effects separately.
Here we are using a similar perturbative approach as in Varniere & Blackman (2005) and take a regular diskbb disk model with T0(r) ∝ r− 3/4 on which we add a component mimicking the structure at the origin of the QPOs, which depends on the radius and azimuthal angle as T1(r,ϕ) = h(r) .s(r−rs,ϕ). For simplicity, we choose to decompose T1 as a height function h, which depends only on r, and a shape function s that is finite only near the disk structure we are studying, which is in turn defined by rs = rs(t,ϕ). Also, for simplicity, we take the shape function to be Gaussian and the height function to be related to the equilibrium temperature T0(r).
Using this structure we can take a variety of shapes into account mimicking a variety of models, for example:
-
a torus with rs(t,ϕ) = cte × sin(νt) and ν the oscillating frequency of the torus, and
-
a hotspot with rs(t,ϕ) = cte for the hotspot azimuthal size and zero otherwise. In the general case this constant, which defines the position of the structure in the disk, is called rc, the corotation radius of the structure. In the case of nonaxisymmetrical structures, such as a blob Ω(rc), the frequency at which the structure is rotating is also the frequency at which the flux is modulated, hence, the QPO frequency.
This provides a simple but useful framework to model a disk with added perturbative structures. Within this framework the perturbed temperature reads ![Mathematical equation: \begin{eqnarray} \label{eq:T} T(r,\varphi) &=& T_0(r) \times\left[1 + \gamma \ \mathrm{exp}\left(-\frac{1}{2}\left(\frac{r-r_s(\varphi)}{\delta \,r_{\rm c}}\right)^2\right)\right]^2 , \end{eqnarray}](/articles/aa/full_html/2016/02/aa27906-15/aa27906-15-eq39.png) (1)where rc(t) is the position of the temperature maximum in the disk (the center of the torus or hotspot). The parameter δ parametrizes the radial extent of the structure, while γ is the maximum amplitude of the perturbation. In the general case rc is allowed to be a function of time to take a change in frequency of the modulation into account, but here we are considering only the case where the QPO frequency is stable during one simulated observation, hence, keeping rc a constant. Indeed, in the blob model the frequency of the modulation is Ω(rc). In that case, the width of the peak in the PDS represents the radial extent of the structure, which is parametrized by δ.
(1)where rc(t) is the position of the temperature maximum in the disk (the center of the torus or hotspot). The parameter δ parametrizes the radial extent of the structure, while γ is the maximum amplitude of the perturbation. In the general case rc is allowed to be a function of time to take a change in frequency of the modulation into account, but here we are considering only the case where the QPO frequency is stable during one simulated observation, hence, keeping rc a constant. Indeed, in the blob model the frequency of the modulation is Ω(rc). In that case, the width of the peak in the PDS represents the radial extent of the structure, which is parametrized by δ.
We use these last two parameters (γ,δ) to mimic a growing flux modulation. Indeed, using similar models we are able to reproduce several timing observables, such as the rms amplitude of QPOs as shown in Varniere & Blackman (2005) for a pseudo-Newtonian potential and Varniere & Vincent (2015b, 2016) in general relativity, thereby validating this simple model as a representation of a disk giving rise to a flux modulation, hence a QPO. All the simulations presented in Table 1 represent an evolving flux modulation from zero to about ~ 20%, which is well inside the observed limits.
Using these parametrized temperature profiles, we then can compute the emitted thermal flux from the entire disk considering it made of multiple blackbody components in a similar manner as in the widely used XSPEC model diskbb for a monotonic profile  (2)where r⋆ is the radius in units of rin the inner disk radius, kb is Boltzmann’s constant, h is Planck’s constant, and c the speed of light. The only difference with the diskbb model is that our T(r,φ) is a nonmonotonic function of r and also of φ, hence, we have to keep both integrals. We then created an XSPEC model of the disk with this structure (which we named diskblob for the case of an elongated hotspot), which will be made available once optimized.
Hot structure parameters and the results from the fit.
This allows us, first, to fit observations with our nonmonotonic disk profile, and second, we can create synthetic spectra of a power law plus the disk taking the presence of a warm/hot structure into account using the procedure fakeit in XSPEC. Using the simulated spectra, we can then test whether the presence of a structure causing a QPO in the PDS would also have a detectable impact on the energy spectrum. Using fakeit in XSPEC presents several limitations since we cannot use time-dependent temperature profiles. Hence, we cannot take the doppler boosting on the structure into account. Both of those limitations can be addressed. Indeed, the simulated spectra are made as observations of 3000 s, hence, are averaged over several thousands of QPO periods. For each observation we took a constant QPO frequency (namely rc is constant) so the temperature profile for the case of an elongated blob is conserved by rotation at the QPO frequency, which allows us to use the time-averaged spectrum2.Concerning the impact of the Doppler boosting, this effect is greatly diminished in the case of a face-on disk so our calculation is valid for a face-on disk and represents a lower limit for more edge-on disks because the Doppler effect boosts the emission of the hotspot, thereby, increasing its impact. Here we are interested to see if this lower limit is already detectable.
4. Impact on the energy spectrum fitting
We computed several synthetic spectra to see whether the presence of a QPO has any impact on the energy spectrum. We used the parameters of XTE J1550-564, which is extensively observed and against which we could then test our results. For each simulation we use the procedure fakeit, assuming an absorbed (phabs) disk (diskblob) plus power law (powerlaw) model. With diskblob, we are able to mimic a disk that has a slowly increasing hot structure with the aim of reproducing the time evolution effect of a growing QPO. The latter is introduced in the model through two parameters (in that case γ and δ only). We then fitted the synthetic spectra with XSPEC following the standard procedure with diskbb and powerlaw.
Using the model presented in Eq. (1), γ represents the amplitude/strength of the instability causing the structure, while δ parametrized its radial extent; this can, in turn, relate to the FWHM of the QPO we are modeling. The value of γ and δ in Table 1 are coherent with the QPO features one would expect during an outburst (as seen in the general case in Varniere & Blackman 2005, then for a particular outburst in Varniere & Vincent 2016). Here we took an origin point from the curve on Fig. 1, at (rin,Tin) = (45,0.7), where Tin is the normalization of T0 in Eq. (1). We chose this point as it is just before we start seeing a departure in the correlation. This means that, in all our simulations, our disk has an inner edge at rin = 45 km and an associated inner edge temperature of 0.7 keV. This allow us to see the discrepancy between the realvalue and the value given by the fit, measured by ΔX = (Xreal−Xfit) /Xreal). This discrepancy is a measure of the accuracy of the fit and its reliability. In all the sets in Table 1(rin,Tin) = (45,0.7) and only the couple (γ,δ) is modified.
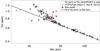 |
Fig. 2 Correlation between the inner edge position and inner edge temperature as given by the spectral fits for the outburst of 98−99 and 2000 of XTE J1550-564. Red dots represent observations with HFQPOs detected while the black dots indicate observations with no detections. The crosses represent the type of LFQPO, black for the common type C, blue for type B, and red for type A. The gray stars are the result of the synthetic spectra fit. Timing data from Remillard et al. (2002) and Rodriguez et al. (2002). |
Following the evolution of the fit parameters, we see that as soon as the QPO has a non-zero amplitude there is a discrepancy between the fitted value of the disk parameters given by the spectral fit and the real value used to create the spectrum.
This discrepancy grows with the QPO amplitude (represented by the parameter γ in our model). In the case of a feature having parameters (γ,δ) = (0.4,0.15), which translate in a 5% flux modulation we obtain ΔTin = 14% and ΔRin = 12%. The fitted values for rin are almost always smaller than the actual value of the disk we input while the Tin are almost always overestimated. Indeed in our case of a real inner edge at 45 km we get some fit results up to about 23 km for our largest features, which is equivalent to an rms of 20%. While the discrepancy is always higher for the temperature, the impact on the determination of the inner radius of the disk is actually more important. Indeed, the minimal position of the inner edge of the disk is often used to put some limits on the spin of the black hole. In that case an underdetermination by almost factor of two between the real value and the fitted value would lead to a much higher inferred spin. In this case, where the inner edge of the disk is at 45 km, which is approximatively 3rg for 10 M⊙, the fit gives back a value of 23 km representing about 1.6rg; this would in turn indicate an almost maximal spin. As this happens when we have strong QPO, it is better to continue using only the value of the radius from states without QPOs to put constraints on the central object spin.
Furthermore, when we plot the results of the fit from the synthetic spectra together with data points from XTE J1550-564 we see, in Fig. 2, that the gray star representing our simulated spectra occupies the same space as the HFQPO/type B LFQPO data points from XTE J1550-564, hence, strengthening the link between QPO, hot spot, and fit difficulties.
We see that, even with the RXTE resolution and range, neglecting the QPO in the spectral analysis can lead to large discrepancies. As a side note, such departure from correlation could be used to detect the possible presence of HFQPOs purely from spectral analysis, but would not allow to predict its parameters as we cannot disentangle the impact of δ and γ on the spectrum.
5. Conclusion
Using a simple model to mimic the emission from a disk with a nonmonotonic temperature, which has been theorized to be the case in the presence of QPOs, we have created synthetic spectra of a system exhibiting an increasingly strong QPOs. This allowed us to study the impact of the structure at the origin of the QPO on the energy spectrum in a clean environment, and to determine whether we can neglect such structure in the spectral fit.
First, our simulated observations are coherent with the departure from the correlation seen in the Tin-rin diagram of XTE J1550-564 in presence of HFQPO and LFQPOs B or A. In the case of very small amplitude QPOs, there is a negligible impact on the energy spectrum and it can be ignored in the spectral fit.
Nevertheless, in presence of a medium strength/impact QPO (more than 5% rms amplitude), we cannot neglect the presence of the hot structure as it leads to significant discrepancy between the fitted value and the physical parameters. Those errors in particular tend to almost exclusively give a smaller inner radius and a higher inner temperature. Therefore, there is a need to improve the disk fitting by taking the structures at the origin of the QPOs into account if we want to constrain the disk parameters in their presence.
As a side note we are looking to see if the few points that depart from the correlation without a published HFQPO frequency have or do not have a high frequency structure fine enough to be a HFQPO.
We also compared an extended blob with a fully axisymmetrical (ring) structure with the same temperature profile and found the results to be globally consistent. Indeed the average profile of a blob of finite azimuthal size would be smaller than the axisymmetric (azimuth of 2π) version of the same blob. This comforted us that a hotter structure present in the disk indeed has an effect on the overall energy spectrum.
Acknowledgments
The author thanks the anonymous referee who helped clarify the paper to this final form. We acknowledge the financial support of the UnivEarthS Labex program at Sorbonne Paris Cité (ANR-10-LABX-0023 and ANR-11-IDEX-0005-02).
References
- Bursa, M., Abramowicz, M. A., Karas, V., & Kluzniak, W. 2004, ApJ, 617, L45 [NASA ADS] [CrossRef] [Google Scholar]
- Ingram, A., Done, C., & Fragile, P. C. 2009, MNRAS, 397, L101 [NASA ADS] [CrossRef] [Google Scholar]
- Karas, V., Vokrouhlicky, D., & Polnarev, A. G. 1992, MNRAS, 259, 569 [NASA ADS] [CrossRef] [Google Scholar]
- Miller, J. M., Wijnands, R., Homan, J., et al. 2001, ApJ, 563, 928 [NASA ADS] [CrossRef] [Google Scholar]
- Miller, J. M., Marshall, H. L., Wijnands, R., et al. 2003, ApJ, 38, 7 [Google Scholar]
- Muno, M. P., Morgan, E. H., & Remillard, R. A. 1999, ApJ, 527, 321 [NASA ADS] [CrossRef] [Google Scholar]
- Pechacek, T., Goosmann, R. W., et al. 2013, A&A, 556, A77 [NASA ADS] [CrossRef] [EDP Sciences] [Google Scholar]
- Remillard, R. A., Sobczak, G. J., et al. 2002, ApJ, 564, 962 [Google Scholar]
- Rodriguez, J., Varniere, P., et al. 2002, A&A, 387, 487 [NASA ADS] [CrossRef] [EDP Sciences] [Google Scholar]
- Rodriguez, J., Corbel, S., & Tomsick, J. A. 2003, ApJ, 595, 1032 [NASA ADS] [CrossRef] [Google Scholar]
- Rodriguez, J., Corbel, S., et al. 2004, ApJ, 612, 1018 [NASA ADS] [CrossRef] [Google Scholar]
- Shimura, T., & Takahara, F. 1995, ApJ, 445, 780 [NASA ADS] [CrossRef] [Google Scholar]
- Schnittman, J. D., & Bertschinger, E. 2004, ApJ, 606, 1098 [NASA ADS] [CrossRef] [Google Scholar]
- Schnittman, J. D., & Rezzolla, L. 2006, ApJ, 637, L113 [NASA ADS] [CrossRef] [Google Scholar]
- Schnittman, J. D., Homan, J., & Miller, J. M. 2004, ApJ, 642, 420 [Google Scholar]
- Sobczak, G. J., McClintock, J. E., Remillard, R. A., et al. 200, ApJ, 544, 993 [Google Scholar]
- Tagger, M., & Pellat, R. 1999, A&A, 349, 1003 [NASA ADS] [Google Scholar]
- Tagger, M., & Varniere, P. 2006, ApJ, 652, 1457 [NASA ADS] [CrossRef] [Google Scholar]
- Varniere, P., & Blackman, E. G. 2005, New Astron., 11, 43 [NASA ADS] [CrossRef] [Google Scholar]
- Varniere, P., & Vincent, F. H. 2015a, A&A, submitted [Google Scholar]
- Varniere, P., & Vincent, F. H., 2015b, SF2A proceeding [Google Scholar]
- Varniere, P., & Vincent, F. H., 2016, ApJ, submitted [Google Scholar]
- Varniere, P., Rodriguez, J., & Tagger, M. 2002, A&A, 387, 497 [NASA ADS] [CrossRef] [EDP Sciences] [Google Scholar]
- Vignarca, F., Migliari, S., et al. 2003, A&A, 397, 729 [NASA ADS] [CrossRef] [EDP Sciences] [Google Scholar]
- Vincent, F. H., Mazur, G. P., Straub, O., et al. 2014, A&A, 563, A109 [NASA ADS] [CrossRef] [EDP Sciences] [Google Scholar]
All Tables
All Figures
|
Fig. 1 Correlation between the inner edge position and inner edge temperature as directly given by the spectral fits for the outburst of 98−99 and 2000 of XTE J1550-564. Red dots represent observations with HFQPOs detected while the black dots indicate observations with no HFQPO detections. The crosses represent the type of LFQPO, black for the common type C, blue for type B, and red for type A. Timing data from Remillard et al. (2002) and Rodriguez et al. (2002). |
| In the text | |
|
Fig. 2 Correlation between the inner edge position and inner edge temperature as given by the spectral fits for the outburst of 98−99 and 2000 of XTE J1550-564. Red dots represent observations with HFQPOs detected while the black dots indicate observations with no detections. The crosses represent the type of LFQPO, black for the common type C, blue for type B, and red for type A. The gray stars are the result of the synthetic spectra fit. Timing data from Remillard et al. (2002) and Rodriguez et al. (2002). |
| In the text | |
Current usage metrics show cumulative count of Article Views (full-text article views including HTML views, PDF and ePub downloads, according to the available data) and Abstracts Views on Vision4Press platform.
Data correspond to usage on the plateform after 2015. The current usage metrics is available 48-96 hours after online publication and is updated daily on week days.
Initial download of the metrics may take a while.