Fig. 2
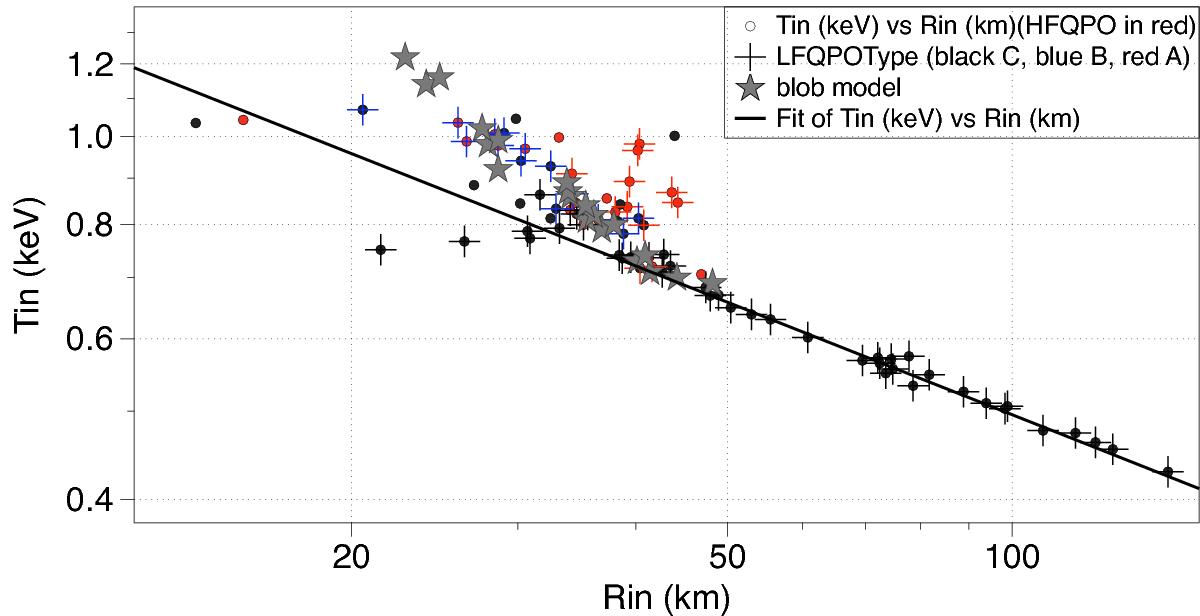
Correlation between the inner edge position and inner edge temperature as given by the spectral fits for the outburst of 98−99 and 2000 of XTE J1550-564. Red dots represent observations with HFQPOs detected while the black dots indicate observations with no detections. The crosses represent the type of LFQPO, black for the common type C, blue for type B, and red for type A. The gray stars are the result of the synthetic spectra fit. Timing data from Remillard et al. (2002) and Rodriguez et al. (2002).
Current usage metrics show cumulative count of Article Views (full-text article views including HTML views, PDF and ePub downloads, according to the available data) and Abstracts Views on Vision4Press platform.
Data correspond to usage on the plateform after 2015. The current usage metrics is available 48-96 hours after online publication and is updated daily on week days.
Initial download of the metrics may take a while.