Fig. 2
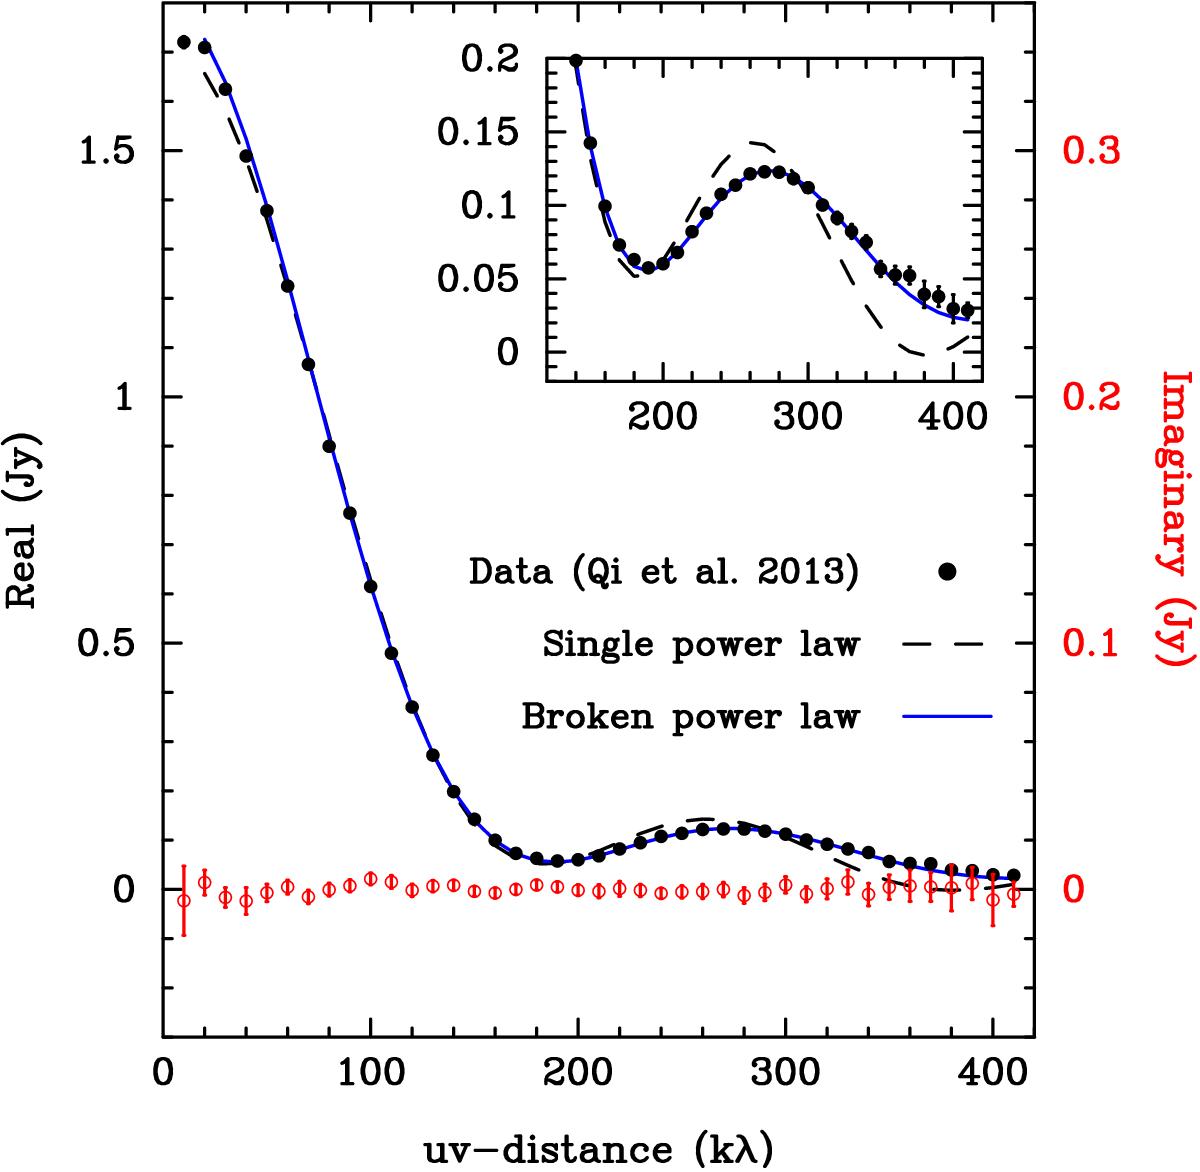
Real (black points) and imaginary (red points) parts of the visibilities of project 340.S (previously presented in Qi et al. 2013) in Jy vs deprojected baseline length in kλ. The inset shows the region of 120–420 kλ in greater detail. The dashed black curve shows the recalculated single power-law model of Andrews et al. (2012, their model pC), which fails to reproduce the data on baselines >290 kλ. A much better fit is found for a broken power-law model described in Sect. 3 (solid blue curve). Because both models are symmetric, the imaginary parts of their visibilities are all 0 (not shown).
Current usage metrics show cumulative count of Article Views (full-text article views including HTML views, PDF and ePub downloads, according to the available data) and Abstracts Views on Vision4Press platform.
Data correspond to usage on the plateform after 2015. The current usage metrics is available 48-96 hours after online publication and is updated daily on week days.
Initial download of the metrics may take a while.