| Issue |
A&A
Volume 586, February 2016
|
|
|---|---|---|
| Article Number | A107 | |
| Number of page(s) | 6 | |
| Section | Astronomical instrumentation | |
| DOI | https://doi.org/10.1051/0004-6361/201527658 | |
| Published online | 02 February 2016 | |
Detection and measurement of micrometeoroids with LISA Pathfinder
1 Gravitational Astrophysics Laboratory, NASA Goddard Space Flight Center, Greenbelt, MD 20771, USA
e-mail: This email address is being protected from spambots. You need JavaScript enabled to view it.
2 Department of Aerospace Engineering, The George Washington University, Washington, DC 20052, USA
3 Meteorites, Minor Bodies and Planetary Sciences Group, Institute of Space Sciences (CSIC-IEEC), Campus UAB Bellaterra, Carrer de Can Magrans, s/n 08193 Cerdanyola del Vallés Barcelona, Spain
Received: 28 October 2015
Accepted: 23 December 2015
Abstract
The Solar System contains a population of dust and small particles originating from asteroids, comets, and other bodies. These particles have been studied using a number of techniques ranging from in-situ satellite detectors to analysis of lunar microcraters to ground-based observations of zodiacal light. In this paper, we describe an approach for using the LISA Pathfinder (LPF) mission as an instrument to detect and characterize the dynamics of dust particles in the vicinity of Earth-Sun L1. Launched on Dec. 3rd, 2015, LPF is a dedicated technology demonstrator mission that will validate several key technologies for a future space-based gravitational-wave observatory. The primary science instrument aboard LPF is a precision accelerometer which we show will be capable of sensing discrete momentum impulses as small as 4 × 10⁻⁸ N s. We then estimate the rate of such impulses resulting from impacts of micrometeoroids based on standard models of the micrometeoroid environment in the inner solar system. We find that LPF may detect dozens to hundreds of individual events corresponding to impacts of particles with masses >10-9g during LPF’s roughly six-month science operations phase in a 5 × 105 km by 8 × 105 km Lissajous orbit around L1. In addition, we estimate the ability of LPF to characterize individual impacts by measuring quantities such as total momentum transferred, direction of impact, and location of impact on the spacecraft. Information on flux and direction provided by LPF may provide insight as to the nature and origin of the individual impact and help constrain models of the interplanetary dust complex in general. Additionally, this direct in situ measurement of micrometeoroid impacts will be valuable to designers of future spacecraft targeting the environment around L1.
Key words: meteorites, meteors, meteoroids / instrumentation: miscellaneous
© ESO, 2016
1. Introduction
Our current understanding of the interplanetary dust complex is informed by a number of measurement techniques including photographic and visual meteors (Halliday et al. 1984; Hawkes 2007; Trigo-Rodriguez et al. 2008), radio meteors, atmospheric collections (Flynn 1994), observation of zodiacal light in thermal (Krick et al. 2012) and visual (Levasseur-Regourd & Dumont 1980) wavelengths, in-situ penetration and ionization detectors (Weidenschilling 1978; Zhang & Kessler 1995), and analysis of microcraters in lunar samples (Allison & McDonnell 1982). Additionally, NASA’s Stardust mission (Hörz et al. 2006) and ESA’s Rosetta mission (Rotundi et al. 2015) have made in-situ measurements of the dust environments near the comets Wild 2 and 67/Churyumov-Gerasimenko respectively. The combined picture from all of these techniques, each with varying ability to detect and characterize various sub-populations of the dust complex, is used to constrain theoretical models that account for the sources, sinks, and dynamics of the dust complex.
The LISA Pathfinder (LPF) mission (Armano et al. 2015), is a technology demonstration mission dedicated to validating several key technologies for a future space-based observatory (Bender & Danzmann 1998; Jennrich 2011) of astrophysical gravitational waves (Einstein 1918; Bondi et al. 1959). Led by the European Space Agency with contributions from NASA and a number of European research institutions, LPF consists of a single sciencecraft operating in a 5 × 105 km by 8 × 105 km Lissajous orbit around the first Sun-Earth (L1) lagrange point. LPF was launched on December 3rd, 2015 and will begin science operations in early 2016 and continue for approximately six months with a possible extension of an additional six months. In this paper, we outline an approach for using LPF as an instrument to detect and characterize interplanetary dust in the vicinity of L1. This technique does not require any modification to the hardware or operations of LPF and may provide an important new source of information to constrain models of the dust complex.
The outline of the paper is as follows. In Sect. 2 we describe the working principle of the LPF instrument and its application as a dust detection instrument. In Sect. 3 we make a simple estimate for the detection threshold of LPF as a function of transferred momentum using a simplified 1D model. In Sect. 4 we estimate the rates of events above this threshold and the total number of likely events during the LPF mission. In Sect. 5 we estimate the precision with which LPF will measure parameters of individual impacts such as momentum transferred and direction of impact. In Sect. 6, we summarize our results and outline likely avenues for refining the estimates made here.
2. Overview of technique
Inside the LPF are two inertial sensor units each containing a test mass comprised of a 46 mm cube of Au-Pt alloy with a mass of 1.96 kg. During launch and cruise, these test masses are mechanically supported by a lock mechanism, which is retracted prior to beginning science operations leaving the test masses freely-falling inside the inertial sensors with no mechanical contacts. Each inertial sensor unit measures the position and attitude of its respective test mass relative to the LPF spacecraft in all six rigid-body kinematic degrees-of-freedom (DoFs) using a capacitive sensing system. The inertial sensor unit can apply forces and torques to the test mass via electrostatic actuation. Additional information is provided by a laser interferometer that measures a three of DoFs (position, tip, and tilt) with higher precision and a star tracker which measures the three angular DoFs of the spacecraft relative to a background inertial reference frame. A control system converts the position and attitude measurements from the two inertial sensors, the interferometer, and the star tracker into force and torque commands that are applied to the test masses and the spacecraft, the latter being actuated using a microthruster system.
The main purpose of the control system is to reduce external force disturbances on the test masses; low-disturbance reference masses are a key technology for LISA-like instruments. A byproduct of this effort is an exquisite measurement of external force disturbances on the LPF spacecraft either through the residual motion between the spacecraft and the test masses or in the applied control forces and torques. One such source of external force disturbance is an impulse generated by an impact of a micrometeoroid or dust particle. In the following sections, we estimate the detection threshold and rate for such impact events.
3. Detection threshold
The momentum transferred to the LPF spacecraft by an individual micrometeoroid impact will combine with stochastic disturbances on the spacecraft from a number of sources such as Solar radiation pressure, outgassing, and noise from the microthruster system. The measured momentum transfer will also be effected by noise in the position sensing system and force disturbances on the test masses. To simplify our estimate of the threshold at which LPF can detect an individual impact, we consider a simplified one-dimensional model in a linear DoF. We adopt the maximum-likelihood formalism, where the signal-to-noise ratio (S/N) of an event is defined using a noise-weighted inner-product:  (1)where ρ is the S/N, F is the “waveform” of the force on the spacecraft resulting from the impact and ⟨ ... | ... ⟩ denotes the noise-weighted inner product defined as:
  (2)where tildes denote Fourier-domain signals and Sn(f) is the one-sided power-spectral density of the equivalent force noise on the spacecraft. Given a waveform F and an estimate of the noise characterized by Sn(f), the S/N can be calculated using (2) and (1). An S/N threshold for detection, typically set around 5–10 to optimize the balance between high detection efficiency and low false alarm probability (Lehmann & Romano 2008), can be used to determine whether an individual event is likely to be observed.
While the error budget developed for LPF contains dozens of individual effects that contribute equivalent force noise to the test masses and spacecraft, there are two effects that dominate force noise on the spacecraft in the measurement band 0.1 mHz ≤ f ≤ 100 mHz. The first is the noise of the microthruster system itself, which is characterized by a flat power spectral density with a level of  (3)The thruster noise dominates at low frequencies but is eclipsed above a few mHz by the equivalent force noise of the inertial sensor. The inertial sensor noise is characterized by a flat displacement amplitude spectral density at a level of ~2 nm / Hz1 / 2. This can be converted to an equivalent force noise on the spacecraft by multiplying by the spacecraft mass (M = 422 kg) and taking two time derivatives. The resulting power spectral density of this equivalent spacecraft force noise from the inertial sensor is given by
 ![Mathematical equation: \begin{eqnarray} S_{\rm is} & \approx& \left[(2\times 10^{-9}\,\textrm{m}/\textrm{Hz}^{1/2})\cdot M \cdot (2\pi f)^2\right]^2 \nonumber \\ & =& 1.1\times 10^{-9}\cdot f^4\,\textrm{N}^2/\textrm{Hz}^5. \label{eq:Sis} \end{eqnarray}](/articles/aa/full_html/2016/02/aa27658-15/aa27658-15-eq20.png) (4)The individual and combined components of the spacecraft equivalent force noise are shown in Fig. 1.
(4)The individual and combined components of the spacecraft equivalent force noise are shown in Fig. 1.
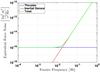 |
Fig. 1 Power spectral density of equivalent spacecraft force noise in a simplified one-dimensional model of LPF. |
An impact by a micrometeoroid is modeled as an impulsive force occurring at time τ and imparting a total momentum P over a characteristic timescale Δ. This can be written in the time and frequency domains respectively as:
![Mathematical equation: \begin{eqnarray} && F(t) = \frac{P}{\Delta}\left[\Theta(t-\tau)-\Theta(t-\tau-\Delta)\right], \label{eq:F_time}\\ && \tilde{F}(f) = P {\rm sinc}(f \Delta){\rm e}^{-2\pi {\rm i f} (\tau+\Delta/2)} \label{eq:F_freq}. \end{eqnarray}](/articles/aa/full_html/2016/02/aa27658-15/aa27658-15-eq24.png) where Θ(t) is the Heaviside step function, and sinc(x) ≡ sin(πx) /πx is the normalized sine cardinal function. One would generally expect that the characteristic impulse times for micrometeoroids would be small compared to the standard sampling rate for LPF data of 1 Hz. In this limit,
where Θ(t) is the Heaviside step function, and sinc(x) ≡ sin(πx) /πx is the normalized sine cardinal function. One would generally expect that the characteristic impulse times for micrometeoroids would be small compared to the standard sampling rate for LPF data of 1 Hz. In this limit,  (7)This provides us with a waveform parametrized by two parameters, total momentum transferred P and impact time τ. Using the expression for
  in (7) and a generic total equivalent force noise of the form Sn(f) ≡ S0 + S4f4, the formula for S/N in (1) can be used to determine the S/N as a function of P:
  (8)where Pc is the characteristic threshold momentum. For the case described above of S0 = 10-16 N2/ Hz and S4 = 1.1 × 10⁻⁹ N2/ Hz5, the characteristic momentum Pc ≈ 3.6 × 10⁻⁸ N s. For an event to be detected with ρ ≥ 8, the total momentum must be P ≥ 8Pc ≈ 2.9 × 10⁻⁷ N s.
4. Rate estimate
The population of dust and micrometeoroids in the inner solar system is derived primarily from the collisional processing of asteroids and comets. The particles making up this population vary in mass, size, composition, and orbit and combine to form a dust complex with a complex morphology (Sykes et al. 2004). The most commonly-used model of the population is the model of Grün, et al. (Grün et al. 1985), which estimates the cumulative flux of micrometeoroids in the inner solar system as a superposition of three distinct populations:
![Mathematical equation: \begin{eqnarray} && \Phi_1(m) = \left(2.2\times10^3 m^{0.306}+15.0\right)^{-4.38},\: 10^{-9}\,\textrm{g} < m < 10^{0}\,\textrm{g}, \nonumber \\[1mm] && \Phi_2(m) = 1.3\times 10^{-9}\left(m+10^{11}m^2+10^{27}m^4\right)^{-0.36},\nonumber \\[1mm] && \qquad \qquad \! 10^{-14}\,\textrm{g} < m < 10^{-9}\,\textrm{g}, \nonumber \\[1mm] && \Phi_3(m) = 1.3\times 10^{-16}\left(m+10^{6}m^2\right)^{-0.85},\: 10^{-18}\,\textrm{g} < m < 10^{-14}\,\textrm{g}, \nonumber \\[1mm] && \Phi(m) = 3.15576\times10^7\left[\Phi_1(m) + \Phi_2(m) + \Phi_3(m)\right]. \label{eq:grun} \end{eqnarray}](/articles/aa/full_html/2016/02/aa27658-15/aa27658-15-eq38.png) (9)The flux Φ(m) represents the total number of particles with mass greater than m grams impacting a unit area from a single hemisphere (2π steradians) in a single year. Figure 2 contains a plot of this model. Much of the literature on micrometeoroid flux addresses issues related to suppression or enhancement of various regions in this power-law due to effects of the Earth and Moon, but for LPF’s orbit around Sun-Earth L1, the unmodified Grün model is most appropriate.
(9)The flux Φ(m) represents the total number of particles with mass greater than m grams impacting a unit area from a single hemisphere (2π steradians) in a single year. Figure 2 contains a plot of this model. Much of the literature on micrometeoroid flux addresses issues related to suppression or enhancement of various regions in this power-law due to effects of the Earth and Moon, but for LPF’s orbit around Sun-Earth L1, the unmodified Grün model is most appropriate.
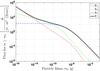 |
Fig. 2 Flux of micrometeoroids with mass m ≥ m0 in the inner Solar system from the Grün, et al. (Grün et al. 1985) model. The dashed lines show the individual components and the solid line shows the total flux as described in (9). |
For detection with LPF, the mass distribution of the micrometeoroid population is just part of the required information. The transferred momentum additionally depends on the relative velocity between the micrometeoroid and the spacecraft. As a zeroth-order estimate, we assume that the characteristic velocity of impacts is equivalent to the orbital velocity of LPF around the Sun, or roughly 30 km s-1. Under the admittedly crude assumption that all impacts occur with this velocity, we can compute the rate of LPF detections as 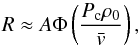 (10)where Φ(m) is the Grün model flux from (9), Pc is the characteristic momentum from (8), ρ0 is the S/N threshold for detection,
  is the characteristic velocity, and A is the cross-sectional area of the spacecraft. For ρ0 = 8 and A = 3 m2, (10) gives R ≈ 1.2 × 10² yr-1 or about 60 events over the 180-day baseline LPF science mission.
Envisioned meteoroid streams contributing to the meteoroid flux in the L1 Lagrange point, and listed from their January to December appearance periods.
To improve upon this rate estimate, we employed the NASA Meteoroid Engineering Model (MEM; McNamara et al. 2004), which was developed to help spacecraft designers and mission planners assess micrometeoroid risk from impacts. To quantify such risk, it is crucial to know the total number of impacts, their mean velocity, and the size of the biggest meteoroid that the spacecraft is likely to encounter. The MEM takes as input a state vector describing the orbit of a spacecraft and returns the total flux and velocity distribution of impacts for particles having a mass m ≥ 10-6g. Because the MEM concentrates on these higher-mass events, which are more rare, it is not by itself useful in determining the number of the events likely to be detected by LPF. However, we can use the MEM to provide an improved estimate of the distribution of impact velocities under the assumption that this distribution is roughly constant as we extend to lower masses. Using a representative state vector for the LPF science orbit provided by ESA, the MEM was used to produce the velocity distribution in Fig. 3. The MEM results are reasonably well fit by a normal distribution with a mean velocity of  and a standard deviation of σv = 9.7 km s-1.
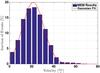 |
Fig. 3 Probability distribution of impact velocities for LPF micrometeoroid collisions during science operations. Histogram in blue are estimates from the NASA Meteoroid Engineering Model and a representative ephemeris for LPF. The fit in red is a best-fit normal distribution. |
Combining the mass flux from the Grün model and the velocity distribution from Fig. 3 produces the impact flux as a function of particle momentum in Fig. 4. Note that for a threshold momentum of 8Pc ≈ 1.7 × 10⁻⁷ N s, the predicted event rate assuming a 3 m2 area is approximately 3 × 10² events per year, about 2.5 times higher than the simple prediction in (10). This increase is due to detections of the high-velocity tail of the lighter particles, which are more numerous.
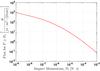 |
Fig. 4 Flux of LPF particle impacts with transferred momenta P ≥ P0 estimated using the Grün model mass flux in Fig. 2 and the fit to the MEM-derived velocity distribution in Fig. 3. |
An improved treatment of the event rate would include a geometrical model for the LPF spacecraft and its orientation as well as any correlations between impact mass and impact velocity.
In addition to the “average” micrometeorite flux estimated using the Grün and MEM models, LPF may also experience episodic increases in flux when LPF’s orbit intersects asteroidal dust trails or cometary meteoroid showers. In principle, any evolved meteoroid stream on Earth having a significant cross section is a potential generator of dust in the L1 environment because the stream cross section increases over time and their meteoroids cross the Earth’s orbit and its surroundings. The most famous annual showers like the Geminids or the Perseids have activity periods on Earth of a week or even more, so they are extended enough to be contributing to L1 (assuming that their activity periods provide a reasonable diameter for the meteoroid stream cross sections). Table 1 compiles our first-guess meteoroid streams contributing significantly to increase the meteoroid flux around the L1 Lagrange point, but the list is not exhaustive. Some old annual showers like the Lyrids, Perseids, Kappa Cygnids or Ursids have perihelion distances close to the L1 Lagrange point and are potential, but probably weak, meteoroid contributors. Obviously, the casual occurrence of dense dust trails is also possible from some periodic comets like e.g. 55P/Tempel-Tuttle that generate the Leonid storms Beech et al. (1999), but they are not expected trail to cross the Earth up to 2033 due to planetary perturbations Jenniskens (2006). Consequently, Table 1 shows that the most favorable dust trail encounter to be detected by LPF is the August 11, 2016 Perseid event produced by the 1862 dust trail of comet 109P/Swift-Tuttle Jenniskens (2006). Another good chance of detecting a high meteoroid flux associated with a dust trail, if LPF operations are finally extended up to mid-2017, could be that associated with comet 73P/Schwasmann-Wachmann 3 (see Tau Herculids in Table 1).
5. Parameter estimation
A key feature of LPF as a micrometeoroid instrument is its ability to estimate certain dynamical parameters for each detection. For example, each LPF test mass will measure the transferred linear momentum from the impact in three orthogonal directions. The error of in the estimate of each of these momentum components will be ~ρ-1 where ρ is the S/N defined in (8). Under the assumption that the error in each momentum component is independent, the two angles describing the impact direction will be measured with errors of roughly 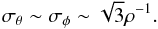 (11)For example, an event with ρ = 10 will have typical errors in the impact angles of 0.17 rad ≈ 10°. Knowledge of the direction of the impact combined with an ephemeris for LPF will allow reconstruction of the impactor’s orbit, a key piece of information for distinguishing different populations of micrometeoroids. For example, it may be possible to measure an excess of impacts coming from a particular direction that could be associated with a known comet. This would allow the velocity of the impact to be inferred from the ephemerides of LPF and the comet which would in turn allow an estimate of the mass of each impacting particle from the measured momentum transfer.
LPF will also measure three components of the angular momentum transferred to the spacecraft. To estimate the noise floor for angular DoF, we follow a similar procedure to the analysis in Sect. 3. The angular sensing noise of the LPF inertial sensor units is characterized by a flat spectrum with an amplitude spectral density of ~200 nrad / Hz1 / 2. This can be converted into an equivalent torque noise by multiplying by the spacecraft moment of inertia ~200 kg m2 and taking two time derivatives. The resulting power spectral density of the equivalent torque noise is ![Mathematical equation: \begin{eqnarray} S_{\rm Nis} & \approx& \left[\left(2\times 10^{-7}\,\textrm{rad}/\textrm{Hz}^{1/2}\right)\cdot I \cdot (2\pi f)^2\right]^2 \nonumber \\ & =& 2.5\times 10^{-6}\cdot f^4\,\textrm{N}^2\cdot\textrm{m}^2~\textrm{Hz}^5. \label{eq:SNis} \end{eqnarray}](/articles/aa/full_html/2016/02/aa27658-15/aa27658-15-eq73.png) (12)The equivalent torque noise of the micropropulsion system can be estimated by multiplying the force noise by a characteristic “lever-arm” corresponding to the perpendicular distance between the spacecraft center of mass and a line along the thrust vector passing through the thruster mounting point. A rough estimate of this value is 0.5 m based on the physical dimensions of the LPF spacecraft. This gives an equivalent torque noise of SNth ≈ 2.5 × 10⁻¹⁷ N2 m2/ Hz2. Figure 5 shows the power spectral density of the total equivalent torque noise for this simplified model.
(12)The equivalent torque noise of the micropropulsion system can be estimated by multiplying the force noise by a characteristic “lever-arm” corresponding to the perpendicular distance between the spacecraft center of mass and a line along the thrust vector passing through the thruster mounting point. A rough estimate of this value is 0.5 m based on the physical dimensions of the LPF spacecraft. This gives an equivalent torque noise of SNth ≈ 2.5 × 10⁻¹⁷ N2 m2/ Hz2. Figure 5 shows the power spectral density of the total equivalent torque noise for this simplified model.
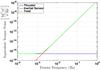 |
Fig. 5 Power spectral density of equivalent spacecraft torque noise in a simplified model of LPF. |
The characteristic angular momentum for LPF can then be computed using (8) with S0 = 2.5 × 10⁻¹⁷ N2 m2/ Hz2 and S4 = 2.5 × 10⁻⁶·f4 N2 m2/ Hz5. The result is Lc = 5.6 × 10⁻⁸ N m s. The typical errors on impact location can then be estimated as  (13)A ρ = 10 event would have typical localization errors of ~16 cm. A more detailed reconstruction of the impact location would include a mechanical model of the spacecraft and might improve the impact localization somewhat. While the impact location is not as useful a measurement for studying the micrometeoroid population as the total momentum or impact direction, it may be of interest to LPF’s operations team.
6. Discussion
The next logical step in this research effort is to refine the estimates made here, taking advantage of the detailed information available about the LPF spacecraft and additional nuances of the known or modeled micrometeoroid environment. Examples of improvements in the LPF model might include proper modeling of the noise and noise correlations in the inertial sensor and thruster subsystems, including the second inertial sensor as a quasi-independent sensor, and an improved rate estimate including a geometrical model of the LPF spacecraft and its orientation during the science operations.
Modifications to the micrometeoroid flux model might include recent radar data (Janches et al. 2015) that indicate a bimodal distribution of velocities in which the fraction of high-velocity meteoroids peaking at 50 − 60 km s-1. If such a high-velocity population exists in the vicinity of L1, it would extend LPF’s detection capability to lower mass particles and further boost the detection rate. Similarly, micrometeoroids coming from high-eccentricity cometary orbits collide at higher velocity than the asteroidal one, so the momentum transferred will be higher and the threshold for mass detection will be lower. We think that such capability to compute the flux from the cometary source and its possible fine-structure associated with the disintegration of periodic comets may also be of interest.
In addition to improving estimates of detection thresholds, event rates, and parameter estimation capabilities, an analysis pipeline could be developed that would detect and characterize events from a stream of LPF science data. Techniques that have already been developed for the analysis of data from ground- and space-based gravitational wave detectors would likely be applicable to this problem.
7. Conclusion
We have outlined a concept for using the LPF spacecraft as an instrument for studying the micrometeoroid environment in the vicinity of Earth-Sun L1 and made rough estimates of the detection threshold, event rates, and errors with which physical parameters are likely to be measured. These estimates suggest that LPF should be capable of detecting dozens to hundreds of individual events during its operational lifetime and will measure their individual momenta, impact directions, and impact locations with interesting precision.
LPF represents a unique and novel opportunity to make in-situ measurements of the micrometeoroid environment in the vicinity of L1, a region for which no in-situ measurements exist. Such measurements can be used to constrain models of the micrometeoroid population in the inner solar system and will complement existing measurements using other techniques. Our proposed method requires no modification to LPF’s hardware or operations, it simply requires a dedicated analysis of the data that will be collected as part of normal science operations.
Acknowledgments
The authors would like to acknowledge Ian Harrison for providing the representative LPF ephemeris file used to estimate the distribution of impact velocities in Sect. 3. J.M.T.R.’s research was supported by the Spanish Ministry of Science and Innovation (project: AYA2011-26522). C.P.’s research was supported by the 2015 NASA Goddard Space Flight Center Summer Internship Program. Copyright (c) 2015 United States Government as represented by the Administrator of the National Aeronautics and Space Administration. No copyright is claimed in the United States under Title 17, US Code. All other rights reserved.
References
- Allison, R. J., & McDonnell, J. A. M. 1982, in Lun. Planet. Sci. Conf. Proc. 12, eds. R. B. Merrill, & R. Ridings, 1703 [Google Scholar]
- Armano, M., Audley, H., Auger, G., et al. 2015, J. Phys. Conf. Ser., 610, 012005 [NASA ADS] [CrossRef] [Google Scholar]
- Beech, M., Jehn, R., Brown, P., & Jones, J. 1999, Acta Astron., 44, 281 [CrossRef] [Google Scholar]
- Bender, P., & Danzmann, K. 1998, Laser Interferometer Space Antenna for the Detection of Gravitational Waves, Pre-Phase A Report, Garching [Google Scholar]
- Bondi, H., Pirani, F. A. E., & Robinson, I. 1959, Roy. Soc. London Proc. Ser. A, 251, 519 [NASA ADS] [CrossRef] [Google Scholar]
- Christou, A. A., Vaubaillon, J., & Withers, P. 2008, Earth Moon and Planets, 102, 125 [NASA ADS] [CrossRef] [Google Scholar]
- Einstein, A. 1918, Sitzungsberichte der Koniglich Preussischen Akademie der Wissenschaften (Berlin), Seite 154-167, 154 [Google Scholar]
- Flynn, G. J. 1994, Planetary and Space Science, 42, 1151 [NASA ADS] [CrossRef] [Google Scholar]
- Grün, E., Zook, H., Fechtig, H., & Giese, R. 1985, Icarus, 62, 244 [NASA ADS] [CrossRef] [Google Scholar]
- Halliday, I., Blackwell, A. T., & Griffin, A. A. 1984, Science, 223, 1405 [NASA ADS] [CrossRef] [Google Scholar]
- Hawkes, R. 2007, Earth, Moon, and Planets, 101, 93 [Google Scholar]
- Hörz, F., Bastien, R., Borg, J., et al. 2006, Science, 314, 1716 [NASA ADS] [CrossRef] [PubMed] [Google Scholar]
- Janches, D., Close, S., Hormaechea, J. L., et al. 2015, ApJ, 809, 36 [NASA ADS] [CrossRef] [Google Scholar]
- Jenniskens, P. 2006, Meteor Showers and their Parent Comets (Cambridge University Press) [Google Scholar]
- Jennrich, O. 2011, LISA: Unveiling a hidden Universe [Google Scholar]
- Jopek, T. J., Valsecchi, G. B., & Froeschlé, C. 2003, MNRAS, 344, 665 [NASA ADS] [CrossRef] [Google Scholar]
- Jopek, T. J., Koten, P., & Pecina, P. 2010, MNRAS, 404, 867 [NASA ADS] [CrossRef] [Google Scholar]
- Krick, J. E., Glaccum, W. J., Carey, S. J., et al. 2012, ApJ, 754, 53 [Google Scholar]
- Lehmann, E., & Romano, J. 2008, Testing Statistical Hypotheses, Springer Texts in Statistics (New York: Springer) [Google Scholar]
- Levasseur-Regourd, A. C., & Dumont, R. 1980, A&A, 84, 277 [NASA ADS] [Google Scholar]
- McNamara, H., Jones, J., Kauffman, B., et al. 2004, Earth, Moon, and Planets, 95, 123 [Google Scholar]
- Rotundi, A., Sierks, H., Della Corte, V., et al. 2015, Science, 347, aaa3905 [Google Scholar]
- Sykes, M. V., Grün, E., Reach, W. T., & Jenniskens, P. 2004, The interplanetary dust complex and comets, eds. M. C. Festou, H. U. Keller, & H. A. Weaver, 677 [Google Scholar]
- Trigo-Rodriguez, J., Madiedo, J. M., Gural, P., et al. 2008, Earth, Moon, and Planets, 102, 231 [Google Scholar]
- Weidenschilling, S. J. 1978, Geophys. Res. Lett., 5, 606 [NASA ADS] [CrossRef] [Google Scholar]
- Zhang, J., & Kessler, D. J. 1995, in LDEF: 69 Months in Space. Third Post-Retrieval Symp., 373 [Google Scholar]
All Tables
Envisioned meteoroid streams contributing to the meteoroid flux in the L1 Lagrange point, and listed from their January to December appearance periods.
All Figures
|
Fig. 1 Power spectral density of equivalent spacecraft force noise in a simplified one-dimensional model of LPF. |
| In the text | |
|
Fig. 2 Flux of micrometeoroids with mass m ≥ m0 in the inner Solar system from the Grün, et al. (Grün et al. 1985) model. The dashed lines show the individual components and the solid line shows the total flux as described in (9). |
| In the text | |
|
Fig. 3 Probability distribution of impact velocities for LPF micrometeoroid collisions during science operations. Histogram in blue are estimates from the NASA Meteoroid Engineering Model and a representative ephemeris for LPF. The fit in red is a best-fit normal distribution. |
| In the text | |
|
Fig. 4 Flux of LPF particle impacts with transferred momenta P ≥ P0 estimated using the Grün model mass flux in Fig. 2 and the fit to the MEM-derived velocity distribution in Fig. 3. |
| In the text | |
|
Fig. 5 Power spectral density of equivalent spacecraft torque noise in a simplified model of LPF. |
| In the text | |
Current usage metrics show cumulative count of Article Views (full-text article views including HTML views, PDF and ePub downloads, according to the available data) and Abstracts Views on Vision4Press platform.
Data correspond to usage on the plateform after 2015. The current usage metrics is available 48-96 hours after online publication and is updated daily on week days.
Initial download of the metrics may take a while.