| Issue |
A&A
Volume 586, February 2016
|
|
|---|---|---|
| Article Number | A85 | |
| Number of page(s) | 6 | |
| Section | Stellar structure and evolution | |
| DOI | https://doi.org/10.1051/0004-6361/201527476 | |
| Published online | 28 January 2016 | |
HD 18078: A very slowly rotating Ap star with an unusual magnetic field structure⋆,⋆⋆
1 Joint ALMA Observatory & European Southern Observatory, Alonso de Cordova 3107, Santiago, Chile
e-mail: gmathys@eso.org
2 Special Astrophysical Observatory, Russian Academy of Sciences, 369167 Nizhnii Arkhyz, Russia
3 Armagh Observatory, College Hill, Armagh, BT61 9DG, Northern Ireland, UK
4 Department of Physics & Astronomy, University of Western Ontario, London, Ontario N6A 3K7, Canada
5 Physics/Astronomy Department, University of Nevada, Las Vegas, 4505 S. Maryland Parkway, Las Vegas, NV 89154-4002, USA
6 Department of Physics, The Citadel, 171 Moultrie Street, Charleston, SC 29409, USA
Received: 29 September 2015
Accepted: 18 November 2015
Context. The existence of a significant population of Ap stars with very long rotation periods (up to several hundred years) has progressively emerged over the past two decades. However, only lower limits of the periods are known for most of them because their variations have not yet been observed over a sufficient timebase.
Aims. We determine the rotation period of the slowly rotating Ap star HD 18078 and we derive constraints on the geometrical structure of its magnetic field.
Methods. We combine measurements of the mean magnetic field modulus obtained from 1990 to 1997 with determinations of the mean longitudinal magnetic field spanning the 1999–2007 time interval to derive an unambiguous value of the rotation period. We show that this value is consistent with photometric variations recorded in the Strömgren uvby photometric system between 1995 and 2004. We fit the variations of the two above-mentioned field moments with a simple model to constrain the magnetic structure.
Results. The rotation period of HD 18078 is (1358 ± 12) d. The geometrical structure of its magnetic field is consistent to first order with a colinear multipole model whose axis is offset from the centre of the star.
Conclusions. HD 18078 is only the fifth Ap star with a rotation period longer than 1000 d for which the exact value of that period (as opposed to a lower limit) could be determined. The strong anharmonicity of the variations of its mean longitudinal magnetic field and the shift between their extrema and those of the mean magnetic field modulus are exceptional and indicative of a very unusual magnetic structure.
Key words: stars: individual: HD 18078 / stars: chemically peculiar / stars: rotation / stars: magnetic field
Based in part on observations made at Observatoire de Haute Provence (CNRS), France; at Kitt Peak National Observatory, National Optical Astronomy Observatory (NOAO Prop. ID: KP2442; PI: T. Lanz), which is operated by the Association of Universities for Research in Astronomy (AURA) under cooperative agreement with the National Science Foundation; at the Canada-France-Hawaii Telescope (CFHT) which is operated from the summit of Maunakea by the National Research Council of Canada, the Institut National des Sciences de l’Univers of the Centre National de la Recherche Scientifique of France, and the University of Hawaii; and at the 6-m telescope BTA of the Special Astrophysical Observatory of the Russian Academy of Sciences.
Table 3 is only available at the CDS via anonymous ftp to cdsarc.u-strasbg.fr (130.79.128.5) or via http://cdsarc.u-strasbg.fr/viz-bin/qcat?J/A+A/586/A85
© ESO, 2016
1. Introduction
A by-product of systematic investigation of the magnetic fields of Ap stars whose spectral lines are observationally resolved into their Zeeman components (Mathys et al. 1997, and references therein) is the finding that the rate of occurrence of long rotation periods in Ap stars is considerably higher than was previously thought. There are at present 35 such stars known to have rotation periods Prot longer than a month (30 d). There is no doubt that these slow rotators represent a significant fraction, of the order of several percent, of the total population of Ap stars. There are also strong indications that the longest periods must reach of the order of 300 yr, and even much higher values – 1000 yr – seem plausible (Mathys 2015).
At the other end of the distribution, the fastest rotating Ap stars have periods of about 0.5 d (e.g. Adelman 2002; Mathys 2004). The 5 to 6 orders of magnitude spanned by their rotation periods make the Ap stars unique on the main sequence. The evolutionary changes of the rotation periods of Ap stars during their main-sequence lifetimes are small, a factor 2 at most (Kochukhov & Bagnulo 2006; Hubrig et al. 2007). Thus period differentiation must have been completed before Ap stars reach the main sequence. How this can be achieved in the early stages of the evolution of stars within a quite limited range of masses (~1.8 to ~3.0 M⊙) represents a major theoretical challenge. The mystery of the very long rotation periods is not primarily one of angular momentum since almost all angular momentum is already gone at modest periods (10 d). A magnetic stellar wind can in principle spin a star down indefinitely, but at long periods it becomes very inefficient.
In the absence of clear theoretical ideas, progress continues to depend on observational clues; one limitation arises from the fact that the timebase over which observations have been obtained for many of the most slowly rotating stars is still shorter than their periods. Accordingly, only lower limits of those periods are available to date, and the incomplete phase coverage of the magnetic data prevents the strengths and the geometrical structures of the fields from being fully characterised.
The most famous example of this situation is γ Equ (=HD 201601). The first determinations of its mean longitudinal magnetic field ⟨ Bz ⟩ were achieved in 1946 by Babcock (1958). Since then, many additional measurements of that field moment have been obtained by a large number of different groups (see Bychkov et al. 2006, 2015, and references therein). They provide a nearly continuous coverage of the ⟨ Bz ⟩ variations over almost 70 yr, but still fall very short of completing a full cycle as the rotation period is most likely around 100 yr.
Most other very slowly rotating Ap stars have been monitored over much shorter timespans. While prior to this study 16 were known (to us) to have rotation periods longer than 1000 d, only for 4 of them had observations been obtained over more than one cycle and the exact value of the period been derived: HD 9996 (Prot = 7937 d, Metlova et al. 2014), HD 59435 (Prot = 1360 d, Wade et al. 1999), HD 94660 (Prot = 2800 d, Mathys, in prep.; see also Hensberge 1993), and HD 187474 (Prot = 2345 d, Mathys 1991). Only lower limits were available for all the others, ranging from ~4.5 to ~100 yr.
Here we report the determination of one more period longer than 1000 d, for the star HD 18078.
HD 18078 (=BD +55 726) is an A0p SrCr star (Renson & Manfroid 2009). On account of its low v sini, it was included by Preston (1970) in a list of 25 stars that might have long periods, which also featured several of the above-mentioned slowly rotating stars (HD 9996, HD 110066, HD 187474, and HD 201601). Preston (1971) inferred from consideration of differential broadening of spectral lines of different magnetic sensitivities that HD 18078 had a magnetic field of the order of 3.8 kG. Photometric observations by Wolff & Morrison (1973) suggested that its period must be longer than one year. Following the observation of lines resolved into their Zeeman components in its spectrum (Mathys & Lanz 1992), HD 18078 was included in the programme of systematic study of Ap stars with magnetically resolved lines that was led by one of our team (GM). Its mean magnetic field modulus was found to show large variations, but the number of measurements obtained by 1995 was not sufficient to determine the stellar rotation period (Mathys et al. 1997).
We present additional determinations of that field moment in Sect. 2, and combine them with measurements of the mean longitudinal magnetic field to derive an unambiguous value for the rotation period. We show in Sect. 3 that this value is consistent with observations of the photometric variations. Finally, in Sect. 4, we present a simple model of the unusual structure of the magnetic field of HD 18078.
2. Magnetic variations
2.1. Mean magnetic field modulus
High-resolution (R = λ/ Δλ ≃ 7 × 10⁴–1.2 × 10⁵) spectra of HD 18078 were recorded in natural light on 11 different nights between October 1990 and December 1997, using the AURELIE spectrograph on the 1.52 m telescope of Observatoire de Haute-Provence, the Gecko spectrograph on the Canada-France-Hawaii Telescope, and the coudé spectrograph with the 0.9 m coudé feed telescope of Kitt Peak National Observatory. The details of the instrumental configurations that were used and the data reduction procedure are as described by Mathys et al. (1997).
The Fe iiλ 6149.2 line is resolved in its two magnetically split components in 9 of the 11 spectra. We measured the wavelength separation of the components to determine the mean magnetic field modulus ⟨ B ⟩ at the corresponding epochs, by application of the formula  (1)In this equation, λr and λb are, respectively, the wavelengths of the red and blue split line components; g is the Landé factor of the split level of the transition (g = 2.70; Sugar & Corliss 1985);
  , with k = 4.67 × 10⁻¹³ Å-1 G-1; λ0 = 6149.258 Å is the nominal wavelength of the considered transition.
In October 1993 and in February 1994, the Fe iiλ 6149.2 line was clearly broadened, but not resolved1. We estimate from its appearance that the mean magnetic field modulus must have been 2.6 kG or somewhat lower on those two dates. The Fe iiλ 6149.2 line has been easily resolved into its magnetically split components in similar observations of stars with a field modulus down to 2.2 kG (Mathys et al. 1997). That it cannot be resolved in HD 18078 reflects the unusually large width of its split components in that star, which implies that the spread of the magnetic field strengths at different locations across the stellar surface is significantly broader than in most other stars with magnetically resolved lines. Figure 1 shows a portion of the spectrum at two epochs, one close to the ⟨ B ⟩ maximum, the other close to its minimum.
The derived values of ⟨ B ⟩ are listed in Table 1, which includes four values already published by Mathys et al. (1997) for the sake of completeness. As mentioned by those authors, the measurement uncertainties are difficult to assess. Here we revise them to 120 G, taking into account both the difficulty of the ⟨ B ⟩ determination because of the unusual width of the resolved line components and the scatter of the ⟨ B ⟩ data point about a sinusoidal fit (see Sect. 2.3). However, this is only a rough estimate. The two above-mentioned observations obtained at epochs when the Fe iiλ 6149.2 line was not resolved into its magnetically split components are flagged as “unresolved” in the last column of Table 1.
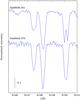 |
Fig. 1 Portion of the spectrum of HD 18078 observed with AURELIE in January 1992 (top; close to the field modulus maximum; ⟨ B ⟩ = 4.4 kG) and in February 1994 (bottom; when the Fe iiλ 6149.2 line was not resolved; ⟨ B ⟩ ≃ 2.6 kG). The lines shown are Cr iiλ 6147.1, Fe iiλ 6147.7, and Fe iiλ 6149.2. |
Mathys et al. (1997) have shown that ⟨ B ⟩ measurements obtained with different telescope and instrument combinations are, in general, quite consistent with each other. As an exception, for a few stars only, mean magnetic field modulus values determined from AURELIE spectra show systematic discrepancies with respect to those obtained with other configurations. The reason is unknown, so that we cannot know if HD 18078 is affected by that systematic error. However, its magnitude does not significantly exceed 160 G for any known case: not only it is of the same order as the estimated ⟨ B ⟩ measurement uncertainties for HD 18078, but it is also quite small with respect to the amplitude of the field modulus variations in that star. Accordingly, we do not expect it to have a significant impact on the analysis performed in this paper. We note in particular that the rotation period of the star, as determined in Sect. 2.3, is primarily constrained by the mean longitudinal magnetic field data, and that all field modulus values, including those derived from AURELIE observations, define a smooth variation curve when plotted against the phases that are computed for that value of the period.
Mean magnetic field modulus measurements.
2.2. Mean longitudinal magnetic field
The Main Stellar Spectrograph of the 6 m telescope BTA of the Special Astrophysical Observatory was used to record medium-resolution (R ≃ 14 500) spectra of HD 18078 on 25 nights from March 1999 to March 2007. The instrumental configuration and the data reduction procedure are as described in detail by Romanyuk et al. (2014).
The mean longitudinal magnetic field ⟨ Bz ⟩ was determined at each epoch from the wavelength shifts of a sample of spectral lines between the two circular polarisations, by application of the formula  (2)where λR (resp. λL) is the wavelength of the centre of gravity of the line in right (resp. left) circular polarisation and
  is the effective Landé factor of the transition. The value of ⟨ Bz ⟩ is determined through a least-squares fit of the measured values of λR−λL by a function of the form given above. The standard error σz that is derived from this least-squares analysis is used as an estimate of the uncertainty affecting the obtained value of ⟨ Bz ⟩.
The values of the mean longitudinal field obtained in this way are presented in Table 2. The signal-to-noise ratio (S/N) of the measured spectra is given in Col. 2.
Mean longitudinal magnetic field measurements.
2.3. Rotation period
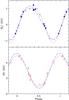 |
Fig. 2 Mean longitudinal magnetic field (top) and mean magnetic field modulus (bottom) of HD 18078 against rotation phase. In the top panel the different symbols distinguish observations obtained in three different consecutive cycles (in order, filled dots, open circles, and filled triangles). In the bottom panel, open squares correspond to observations obtained with AURELIE, filled squares to KPNO coudé spectra, and filled triangles to GECKO data. The two open triangles pointing downwards identify upper limit estimates from AURELIE spectra in which the Fe iiλ 6149.2 line is not magnetically resolved (see text). The short-dashed lines are the best fits of the observations by a cosine wave (for ⟨ B ⟩) and by a cosine wave and its first harmonic (for ⟨ Bz ⟩). The long-dashed lines show the variations of the two considered field moments that are predicted by the simple model discussed in Sect. 4. |
Following Manfroid & Mathys (1997), the rotation period Prot of HD 18078 was derived by looking for the best fit of its magnetic variations by either a cosine wave, or by the superposition of a cosine wave and of its first harmonic. This analysis unambiguously indicated that Prot = 1358 d. In particular, shorter periods are definitely ruled out. The uncertainty of the derived period was estimated by varying it between 1338 d and 1378 d, and by plotting for each trial a phase diagram of the longitudinal field, in which different symbols were used to represent the measurements corresponding to different cycles (three of them in total). In this way, we were able to determine when a significant systematic phase shift started to appear from one cycle to the next, indicative of a value of the period that is either too large or too small. The threshold was found at ± 12 d, so that, finally,  (3)The corresponding best fits are
 ![\begin{eqnarray} \Hz(\phi)&=&(158\pm14)\nonumber\\ &&+\,(1070\pm20)\,\cos\{2\pi\,[\phi-(0.330\pm0.003)]\}\nonumber\\ &&+\,(217\pm20)\,\cos\{2\pi\,[2\phi-(0.196\pm0.013)]\},\\ \Hm(\phi)&=&(3450\pm60)\nonumber\\ &&+\,(993\pm105)\,\cos\{2\pi\,[\phi-(0.000\pm0.012)]\}, \end{eqnarray}](/articles/aa/full_html/2016/02/aa27476-15/aa27476-15-eq43.png) where the field strengths are expressed in Gauss, φ = (HJD−HJD0) /Prot (mod 1), and the adopted value of HJD0 = 2 449 930.0 corresponds to a maximum of the mean magnetic field modulus. The field measurements and the fitted curves are shown in Fig. 2. For the two high-resolution spectra in which the Fe iiλ 6149.2 line is not observationally resolved into its magnetically split components, estimates of the upper limit of ⟨ B ⟩ at the corresponding phases are also shown.
where the field strengths are expressed in Gauss, φ = (HJD−HJD0) /Prot (mod 1), and the adopted value of HJD0 = 2 449 930.0 corresponds to a maximum of the mean magnetic field modulus. The field measurements and the fitted curves are shown in Fig. 2. For the two high-resolution spectra in which the Fe iiλ 6149.2 line is not observationally resolved into its magnetically split components, estimates of the upper limit of ⟨ B ⟩ at the corresponding phases are also shown.
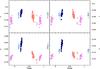 |
Fig. 3 Phase diagrams of the uvby photometric measurements of HD 18078 for the rotation period Prot = 1358 d derived from analysis of the magnetic variations and phase origin HJD0 = 2 449 930.0. Different symbols are used to distinguish the observing seasons: open circles: 1995–96; filled squares: 1997–98; filled triangles: 1998–99; open squares: 2001–02; full dots: 2003–04. |
The ⟨ B ⟩ fit has been restricted to a single cosine, since the first harmonic would not be formally significant. In contrast, the ⟨ Bz ⟩ variation curve very significantly departs from a single sinusoid. This is quite unusual. While some anharmonicity of the ⟨ B ⟩ variations is observed rather frequently, for more than 90% of the Ap stars with resolved lines for which the ⟨ Bz ⟩ variations have been characterised, these variations do not show any significant departure from harmonicity. In the few cases when such departures occur, the field modulus variations are also anharmonic. Thus HD 18078 is unique in showing anharmonic variations of the longitudinal field but not of the field modulus.
Furthermore, HD 18078 also shows a large shift (0.17) between the phase of the negative extremum of ⟨ Bz ⟩ and the phase of maximum ⟨ B ⟩. Again, this is exceptional; in most Ap stars with magnetically resolved lines, both curves are either almost exactly in phase or almost exactly in antiphase.
We return to these anomalies in Sect. 4.
3. Photometric variations
Strömgren four-colour measurements of HD 18078 were obtained using the Four College Automatic Photometric Telescope (FCAPT) from 1995 through 2004 as part of a programme to find and improve the periods of magnetic chemically peculiar (mCP) stars. The comparison star was HD 18460 and the check star was HD 17429. The comparison and check stars are near the variable on the sky and have similar V magnitudes and B−V colors. They were chosen from presumably non-variable stars according to Hipparcos photometry (ESA 1997). The FCAPT first measures the dark count and then in each filter sky-ch-c-v-c-v-c-v-c-ch-sky for each group of variable (v), check (ch), and comparison (c) stars, where sky is a reading of the sky.
The FCAPT operated from 1990 through 2013. It is an automated telescope without an on-site observer, thus the users have to be especially careful about which data to keep. Data from groups that were not completely observed were not analysed. In a group, if any of the standard deviations of the differences between the comparison and check stars exceeded 2% of the average values, we excluded all the observations of the affected group following Strassmeier & Hall (1988). Light curve inspections still showed some obvious outliers. Then we compared the difference between the value of an apparent outlier and the value of the fit at a given phase to the standard deviation of the fit. Any points more than 3 standard deviations from the fit in any filter were removed from the data sets of all filters.There were only three such outliers, two of which were only discrepant in the u and v filters, that were not used in the periodograms. For the third, the values in b and y were just above the threshold for discarding data. Including these points in the phase diagrams clearly shows that they would not change the results from the periodograms.
The photometric data are in Table 3, available at the CDS, which contains the following information. Column 1 lists the heliocentric Julian Date, Cols. 2 through 9 give the variable-comparison magnitude (v−c) and comparison-check (c−ch) magnitude for the uvby filters, respectively.
The uvby phase coverage of HD 18078 is limited but the variations are consistent with the period of 1358 d determined from the magnetic measurements (Fig. 3). We used the Scargle periodogram (Scargle 1982; Horne & Baliunas 1986) to search for periodic variations in the uvby data; one of the peaks was near 1400 d. Although the 1995–96 and 2003–04 FCAPT data are better aligned if a period of 1405 d is used, the ⟨ Bz ⟩ data, which were obtained over three cycles of variation, show systematic shifts between consecutive cycles when plotted with the longer period and are better matched with the 1358-d period. The other peaks we found were for periods of 292 d and 1639 d, neither of which is fit by the magnetic data.
Although the phases of the photometric extrema are uncertain because of incomplete coverage, they definitely appear shifted with respect to those of the mean magnetic field modulus. Most likely, brightness minimum (in all four Strömgren bands) occurs close to the negative ⟨ Bz ⟩ extremum, and brightness maximum close to the positive ⟨ Bz ⟩ extremum, which is shallower. This suggests that the brightness distribution over the stellar surface may to first order be symmetric about the magnetic axis, and show a monotonic gradient from the darker negative magnetic pole to the brighter positive pole.
4. Discussion
Besides the significance of the addition of a fifth star to the group of Ap stars with exactly known rotation periods longer than 1000 d, HD 18078 proves to be a particularly interesting object because of the unusual structure of its magnetic field. This shows through in a number of different ways: the magnetically split components of the Fe iiλ 6149.2 line are exceptionally broad; the variation curve of the mean longitudinal magnetic field is strongly anharmonic, while that of the mean magnetic field modulus does not show any significant departure from a sinusoid; and the phase difference between these two curves is closer to quadrature than to phase coincidence or anti-coincidence. In all these respects, the behaviour of HD 18078 is significantly different from that of the vast majority of the Ap stars with magnetically resolved lines.
In particular, the considerable phase shift between the ⟨ B ⟩ and ⟨ Bz ⟩ variation curves implies that the magnetic field cannot be symmetric about an axis passing through the centre of the star. Thus, it cannot be approximated by a simple symmetric model such as successfully used by Landstreet & Mathys (2000) for a statistical sample of Ap stars with magnetically resolved lines. However, the curves of variation of ⟨ B ⟩ and ⟨ Bz ⟩ look separately rather like those of stars which can be described by the simple centred, colinear multipole model used in that work. We consider whether we can find a simple modification of that class of models that reproduces at least the qualitative features of the data on HD 18078.
We start from the view that the approximately sinusoidal variation of ⟨ Bz ⟩, and the modest ratio ⟨ B ⟩ / ⟨ Bz ⟩ ~ 3, both suggest that there is an important component of the field that is roughly dipolar. The failure of the global dipolar topology for this star appears to be due to a stronger field in the hemisphere that is coming into view as the negative pole rotates out of sight behind the star and the positive pole rotates into sight, compared to the weaker field that comes into view as the positive pole of the dipole recedes behind the star. Thus, we could consider a perturbed colinear multipole model in which the field in one hemisphere is made weaker than in the other hemisphere.
A simple version of this idea can be implemented by considering a coordinate system anchored to the star, with its zm axis parallel to the axis of the unperturbed dipole, the xm axis in the plane of the stellar rotation axis and the unperturbed dipole, and the ym axis perpendicular to the plane of the rotation axis and the unperturbed dipole axis. It is clear that we need a perturbation in the ym direction, with regions of ym> 0 perturbed in the opposite sense to regions with ym< 0. Within the programmes that we use for computations of the field predicted by the centred colinear multipole model, a perturbation of this form is very easy to implement. One of the simplest is to modify the equations of the dipole, quadrupole, etc., in such a way that the field on the surface of the star with a particular ym coordinate is increased or decreased by a factor 1 + Aym. Since we take the magnetic coordinates to be normalised to the star radius, we consider | A | < 1.
A few experiments showed that a value of A ≈ 0.4 together with suitable polar strengths for the unperturbed dipole, quadrupole, and octupole (which the modelling programme tries to optimise for a good fit to the observations) is capable of reproducing qualitatively the most extraordinary feature of the ⟨ B ⟩ and ⟨ Bz ⟩ curves, namely the large phase shift between the extrema of the two curves, and – at least approximately – also fits the shapes of both curves (see Fig. 2). This supports the qualitative discussion above and validates the idea that the main perturbation on the simple multipolar model that is needed to describe the observations is to make the field in one hemisphere of the star (with ym> 0) stronger and the field in the other hemisphere (ym< 0) weaker.
Clearly it will be possible to map this behaviour in more detail (e.g. Silvester et al. 2015) when suitable observational material (polarised spectra in all four Stokes parameters, distributed over the full rotation cycle) becomes available. Of course, the very small value of v sini means that HD 18078 is not remarkably suitable for mapping as there is no velocity resolution across the disk, so such a map will probably lack detail. Nevertheless, we expect that it will qualitatively reflect the hemispheric asymmetry that we have identified.
As time passes and data covering a full rotation cycle become available for an increasing number of Ap stars with periods of several years, it will be interesting to find out if the kind of asymmetric magnetic field structure found in HD 18078 is more likely to occur in extremely slowly rotating stars than in shorter period ones, or if the conjunction of such a structure and very slow rotation in HD 18078 is purely coincidental.
An unrecognised radiation event in the middle of the line was originally mistaken for magnetic resolution, leading to publication of a spurious value of ⟨ B ⟩ by Mathys et al. (1997) for the October 1993 observation (on HJD 2 449 286.660). That measurement is superseded by the upper limit estimate presented here.
Acknowledgments
I.I.R. and D.O.K. are grateful to the Russian Scientific Foundation for partial financial support of the observations with the 6 m telescope and data reduction (RSF grant 14-50-00043).
References
- Adelman, S. J. 2002, Balt. Astron., 11, 475 [NASA ADS] [Google Scholar]
- Babcock, H. W. 1958, ApJS, 3, 141 [NASA ADS] [CrossRef] [Google Scholar]
- Bychkov, V. D., Bychkova, L. V., & Madej, J. 2006, MNRAS, 365, 585 [NASA ADS] [CrossRef] [Google Scholar]
- Bychkov, V. D., Bychkova, L. V., & Madej, J. 2015, in Physics and Evolution of Magnetic and Related Stars, eds. Y. Y. Balega, I. I. Romanyuk, & D. O. Kudryavtsev, ASP Conf. Ser., 494, 100 [Google Scholar]
- ESA 1997, The HIPPARCOS and TYCHO catalogues, SP 1200 (Noordwijk: ESA) [Google Scholar]
- Hensberge, H. 1993, in Peculiar versus Normal Phenomena in A-type and Related Stars, eds. M. M. Dworetsky, F. Castelli, & R. Faraggiana, IAU Colloq. 138, ASP Conf. Ser., 44, 547 [Google Scholar]
- Horne, J. H., & Baliunas, S. L. 1986, ApJ, 302, 757 [NASA ADS] [CrossRef] [Google Scholar]
- Hubrig, S., North, P., & Schöller, M. 2007, Astron. Nachr., 328, 475 [NASA ADS] [CrossRef] [Google Scholar]
- Kochukhov, O., & Bagnulo, S. 2006, A&A, 450, 763 [NASA ADS] [CrossRef] [EDP Sciences] [Google Scholar]
- Landstreet, J. D., & Mathys, G. 2000, A&A, 359, 213 [NASA ADS] [Google Scholar]
- Manfroid, J., & Mathys, G. 1997, A&A, 320, 497 [NASA ADS] [Google Scholar]
- Mathys, G. 1991, A&AS, 89, 121 [NASA ADS] [Google Scholar]
- Mathys, G. 2004, in Stellar Rotation, eds. A. Maeder, & P. Eenens, IAU Symp., 215, 270 [Google Scholar]
- Mathys, G. 2015, in Physics and Evolution of Magnetic and Related Stars, eds. Y. Y. Balega, I. I. Romanyuk, & D. O. Kudryavtsev, ASP Conf. Ser., 494, 3 [Google Scholar]
- Mathys, G., & Lanz, T. 1992, A&A, 256, 169 [NASA ADS] [Google Scholar]
- Mathys, G., Hubrig, S., Landstreet, J. D., Lanz, T., & Manfroid, J. 1997, A&AS, 123, 353 [NASA ADS] [CrossRef] [EDP Sciences] [Google Scholar]
- Metlova, N. V., Bychkov, V. D., Bychkova, L. V., & Madej, J. 2014, Astrophys. Bull., 69, 315 [NASA ADS] [CrossRef] [Google Scholar]
- Preston, G. W. 1970, PASP, 82, 878 [NASA ADS] [CrossRef] [Google Scholar]
- Preston, G. W. 1971, ApJ, 164, 309 [NASA ADS] [CrossRef] [Google Scholar]
- Renson, P., & Manfroid, J. 2009, A&A, 498, 961 [NASA ADS] [CrossRef] [EDP Sciences] [Google Scholar]
- Romanyuk, I. I., Semenko, E. A., & Kudryavtsev, D. O. 2014, Astrophy. Bull., 69, 427 [Google Scholar]
- Scargle, J. D. 1982, ApJ, 263, 835 [NASA ADS] [CrossRef] [Google Scholar]
- Silvester, J., Kochukhov, O., & Wade, G. A. 2015, MNRAS, 453, 2163 [NASA ADS] [CrossRef] [Google Scholar]
- Strassmeier, K. G., & Hall, D. S. 1988, ApJS, 67, 439 [NASA ADS] [CrossRef] [Google Scholar]
- Sugar, J., & Corliss, C. 1985, Atomic energy levels of the iron-period elements: Potassium through Nickel [Google Scholar]
- Wade, G. A., Mathys, G., & North, P. 1999, A&A, 347, 164 [NASA ADS] [Google Scholar]
- Wolff, S. C., & Morrison, N. D. 1973, PASP, 85, 141 [NASA ADS] [CrossRef] [Google Scholar]
All Tables
All Figures
|
Fig. 1 Portion of the spectrum of HD 18078 observed with AURELIE in January 1992 (top; close to the field modulus maximum; ⟨ B ⟩ = 4.4 kG) and in February 1994 (bottom; when the Fe iiλ 6149.2 line was not resolved; ⟨ B ⟩ ≃ 2.6 kG). The lines shown are Cr iiλ 6147.1, Fe iiλ 6147.7, and Fe iiλ 6149.2. |
| In the text | |
|
Fig. 2 Mean longitudinal magnetic field (top) and mean magnetic field modulus (bottom) of HD 18078 against rotation phase. In the top panel the different symbols distinguish observations obtained in three different consecutive cycles (in order, filled dots, open circles, and filled triangles). In the bottom panel, open squares correspond to observations obtained with AURELIE, filled squares to KPNO coudé spectra, and filled triangles to GECKO data. The two open triangles pointing downwards identify upper limit estimates from AURELIE spectra in which the Fe iiλ 6149.2 line is not magnetically resolved (see text). The short-dashed lines are the best fits of the observations by a cosine wave (for ⟨ B ⟩) and by a cosine wave and its first harmonic (for ⟨ Bz ⟩). The long-dashed lines show the variations of the two considered field moments that are predicted by the simple model discussed in Sect. 4. |
| In the text | |
|
Fig. 3 Phase diagrams of the uvby photometric measurements of HD 18078 for the rotation period Prot = 1358 d derived from analysis of the magnetic variations and phase origin HJD0 = 2 449 930.0. Different symbols are used to distinguish the observing seasons: open circles: 1995–96; filled squares: 1997–98; filled triangles: 1998–99; open squares: 2001–02; full dots: 2003–04. |
| In the text | |
Current usage metrics show cumulative count of Article Views (full-text article views including HTML views, PDF and ePub downloads, according to the available data) and Abstracts Views on Vision4Press platform.
Data correspond to usage on the plateform after 2015. The current usage metrics is available 48-96 hours after online publication and is updated daily on week days.
Initial download of the metrics may take a while.