Fig. 9
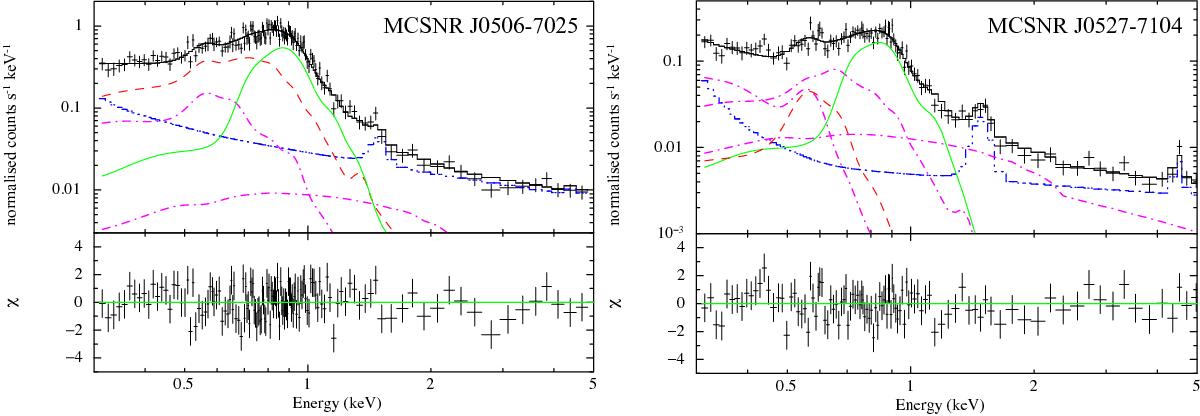
Left: best-fit vsedov+vnei model to the X-ray spectrum of MCSNR J0506−7025. The green solid line represents the pure Fe component, the dashed red line shows shell component, the magenta dash-dot lines indicate the AXB components, and the blue dash-dot-dot-dot line shows the combined contributions of the QPB, instrumental fluorescence lines, and electronic noise. Right: best-fit vnei+vnei model to the X-ray spectrum of MCSNR J0527−7104. Same as left except the dashed red line represents the pure O component. In both cases, only the EPIC-pn spectrum is shown for clarity. Best-fit parameters for MCSNR J0506−7025 and MCSNR J0527−7104 are given in Tables 2 and 3, respectively.
Current usage metrics show cumulative count of Article Views (full-text article views including HTML views, PDF and ePub downloads, according to the available data) and Abstracts Views on Vision4Press platform.
Data correspond to usage on the plateform after 2015. The current usage metrics is available 48-96 hours after online publication and is updated daily on week days.
Initial download of the metrics may take a while.