Free Access
Fig. 6
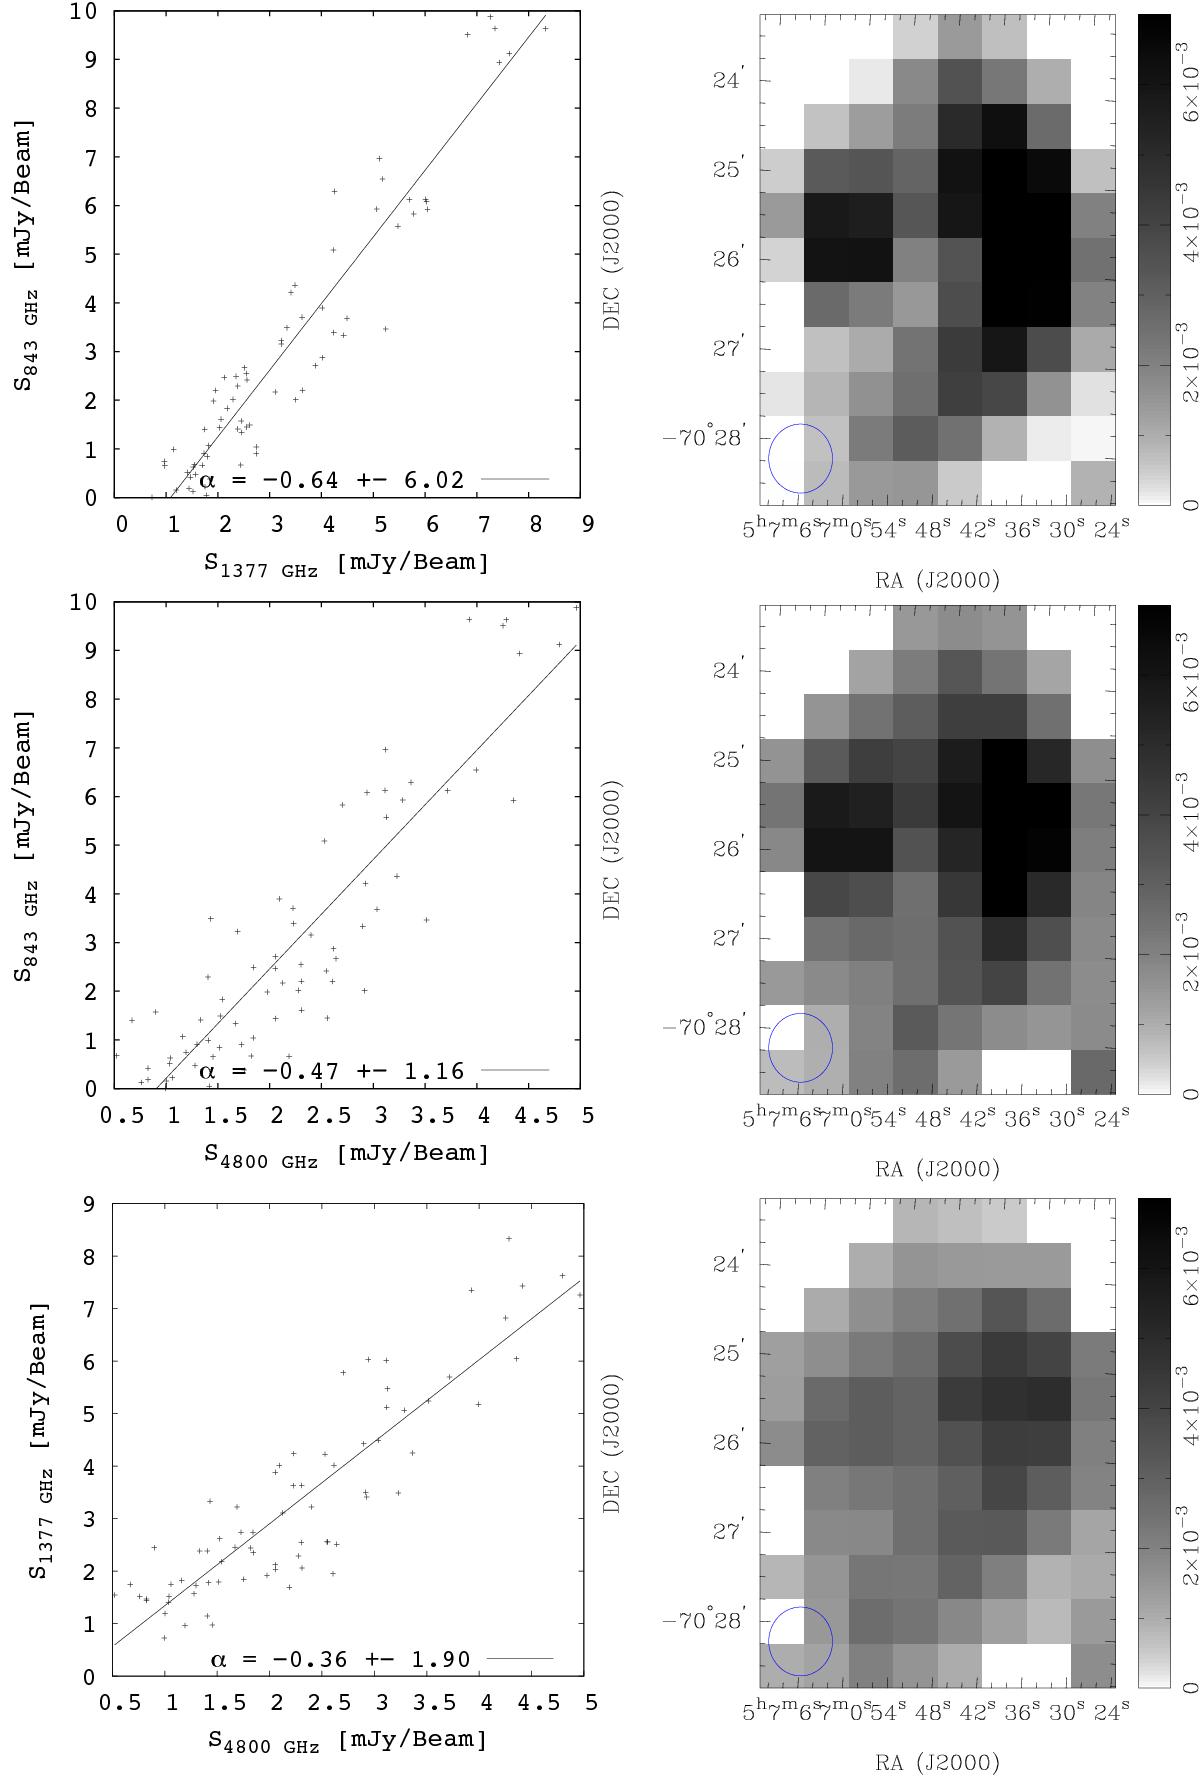
Left: T-T plots of MCSNR J0506−7025 between 36–20 cm, 36–6 cm, and 20–6 cm (top to bottom). Right: intensity images showing the region and strength of the emission from 36, 20, and 6 cm images (top-to-bottom).
Current usage metrics show cumulative count of Article Views (full-text article views including HTML views, PDF and ePub downloads, according to the available data) and Abstracts Views on Vision4Press platform.
Data correspond to usage on the plateform after 2015. The current usage metrics is available 48-96 hours after online publication and is updated daily on week days.
Initial download of the metrics may take a while.