Fig. 2
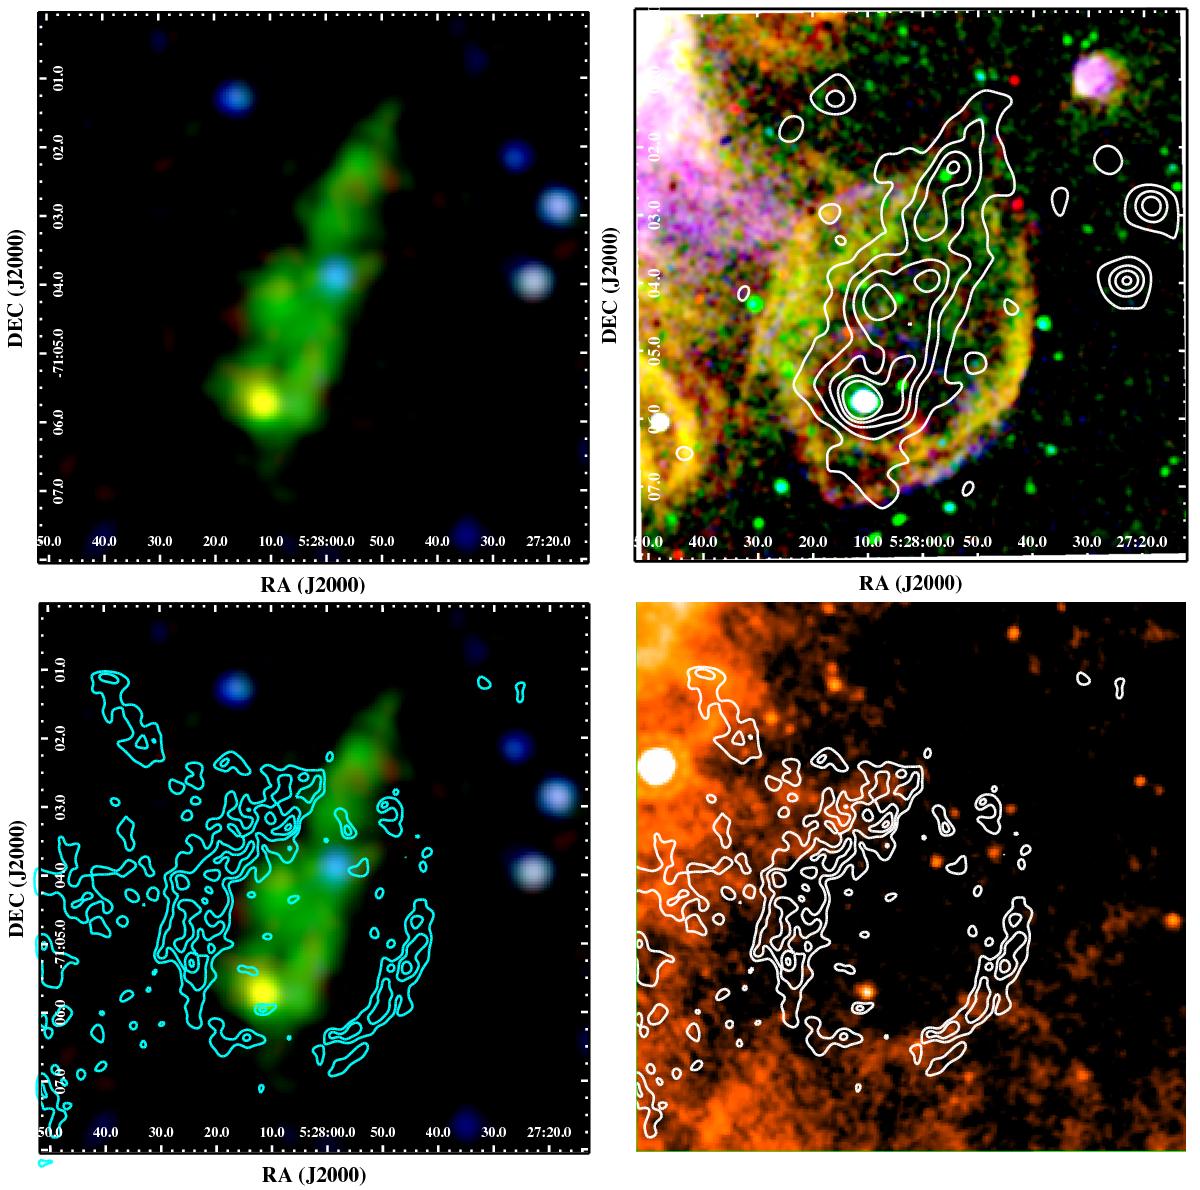
Top left: XMM-Newton EPIC image of MCSNR J0527−7104 in false colour with RGB corresponding to 0.3–0.7 keV, 0.7–1.1 keV, and 1.1–4.2 keV, respectively. Top right: continuum subtracted MCELS image of MCSNR J0527−7104 from KSP13 with Hα in red, [S ii] in green, and [O iii] in blue overlaid with 0.3–0.7 keV contours. The lowest contour level represents 3σ above the average background surface brightness, with the remaining levels indicating 25%, 50%, and 75% of the maximum above this level. Bottom left: same as top left but with [S ii]/Hα contours with the lowest level corresponding to [S ii]/Hα = 0.67, and the remaining levels at 25%, 50%, and 75% of the maximum above this level (from KSP13). Bottom right: Spitzer MIPS 24 μm image of the MCSNR J0527−7104 region with [S ii]/Hα contours from bottom left. The image scale is the same as in all other panels.
Current usage metrics show cumulative count of Article Views (full-text article views including HTML views, PDF and ePub downloads, according to the available data) and Abstracts Views on Vision4Press platform.
Data correspond to usage on the plateform after 2015. The current usage metrics is available 48-96 hours after online publication and is updated daily on week days.
Initial download of the metrics may take a while.