Fig. 12
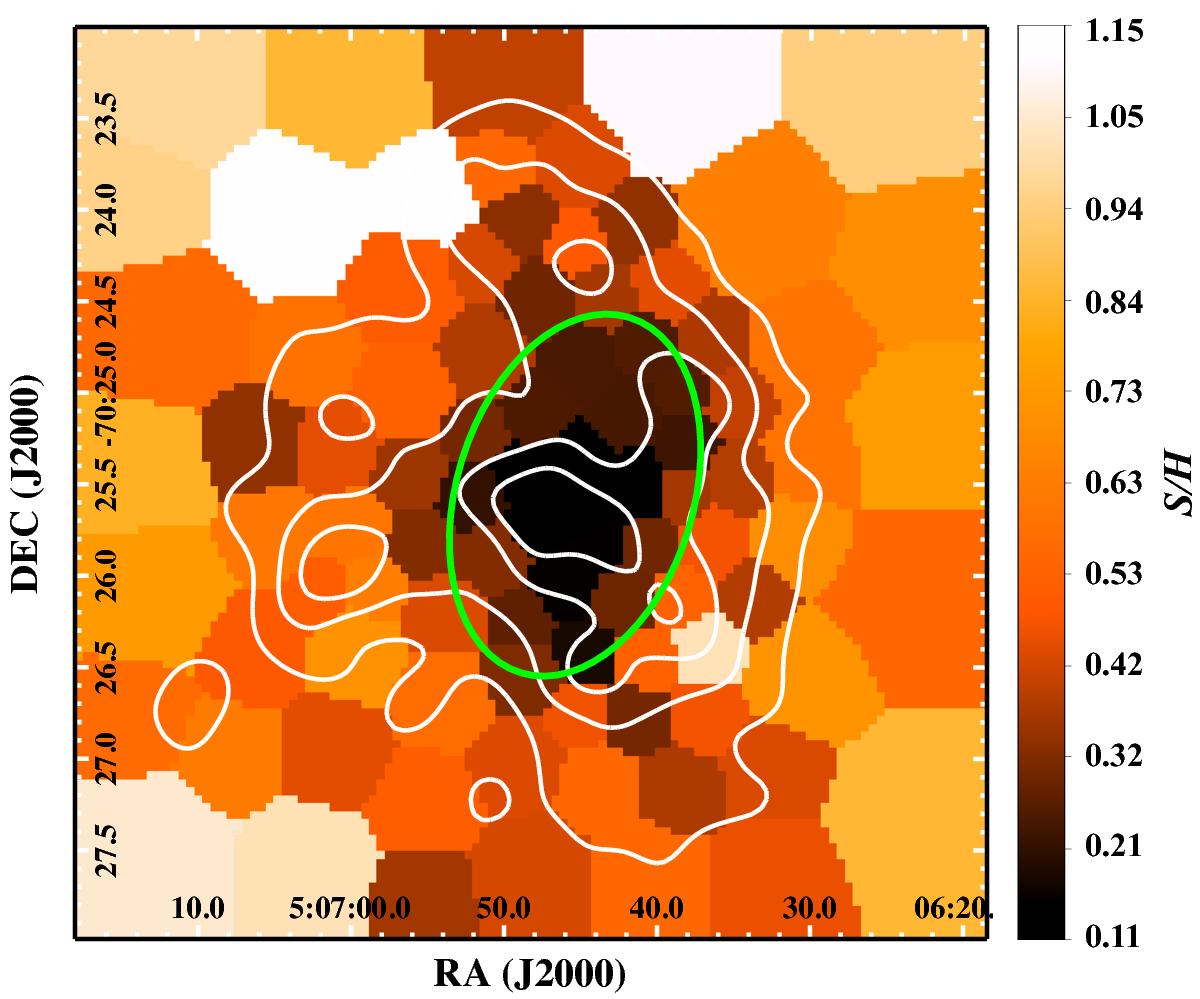
WVT X-ray colour map of MCSNR J0506−7025. The tessellates are defined so that each has a S/N of 5. Lower values of S/H indicate higher contributions from Fe L-shell emission. The white contours show the 0.3–0.7 keV counters from Fig. 1-top right and the green ellipse outlines the Fe L-shell emission regions, set to S/H< 0.3 (see text).
Current usage metrics show cumulative count of Article Views (full-text article views including HTML views, PDF and ePub downloads, according to the available data) and Abstracts Views on Vision4Press platform.
Data correspond to usage on the plateform after 2015. The current usage metrics is available 48-96 hours after online publication and is updated daily on week days.
Initial download of the metrics may take a while.