Fig. 7
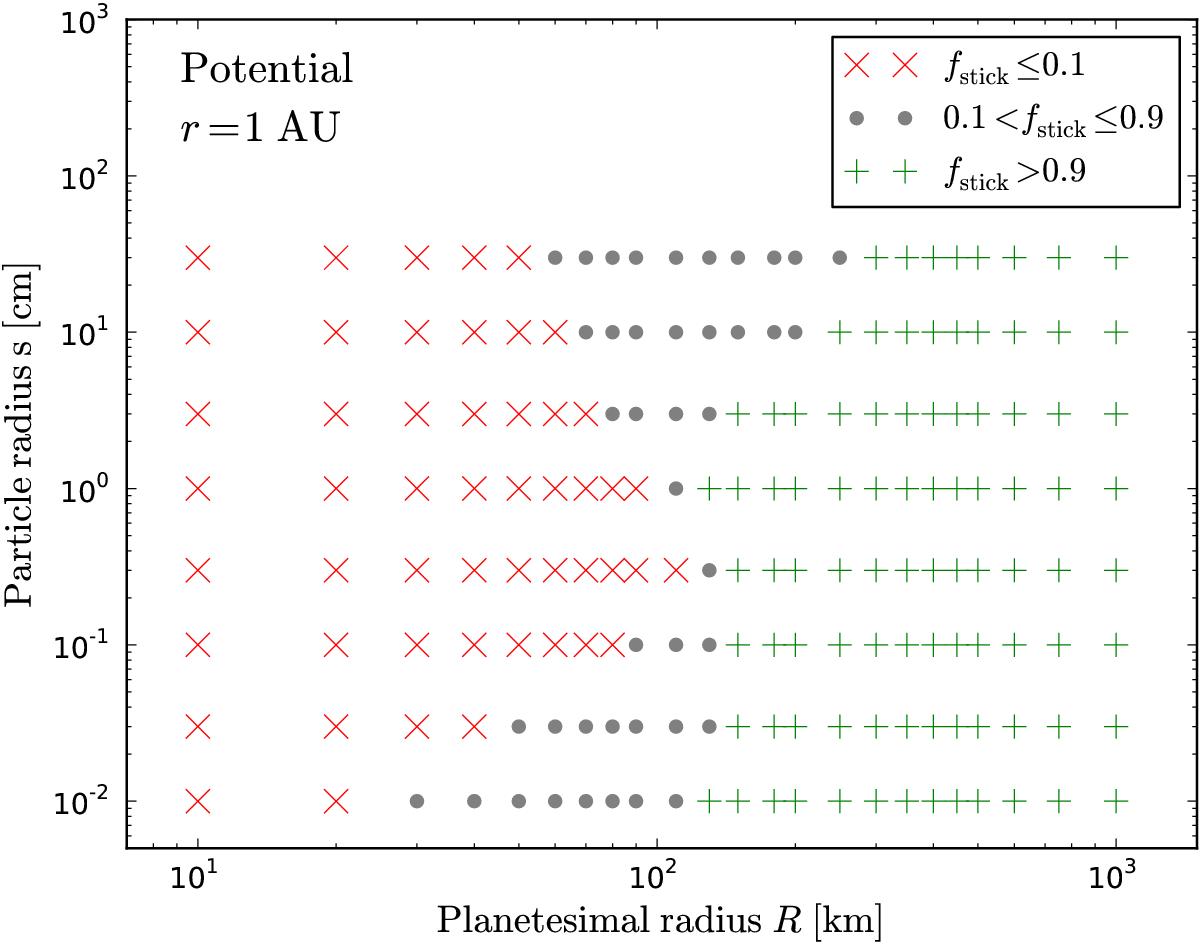
Scatter plot of planetesimal radius R vs. particle radius s for potential flow at 1 AU from the star. The scatter plot shows the result of streamline integrations of the same parameter space as in Fig. 3a, assuming particles bounce off the surface. After 10 bounces, particles are considered accreted. The red crosses represent a sticking fraction of fstick< 0.1, the gray dots of 0.1 <fstick ≤ 0.9 and the green crosses fstick> 0.9.
Current usage metrics show cumulative count of Article Views (full-text article views including HTML views, PDF and ePub downloads, according to the available data) and Abstracts Views on Vision4Press platform.
Data correspond to usage on the plateform after 2015. The current usage metrics is available 48-96 hours after online publication and is updated daily on week days.
Initial download of the metrics may take a while.