Fig. 5
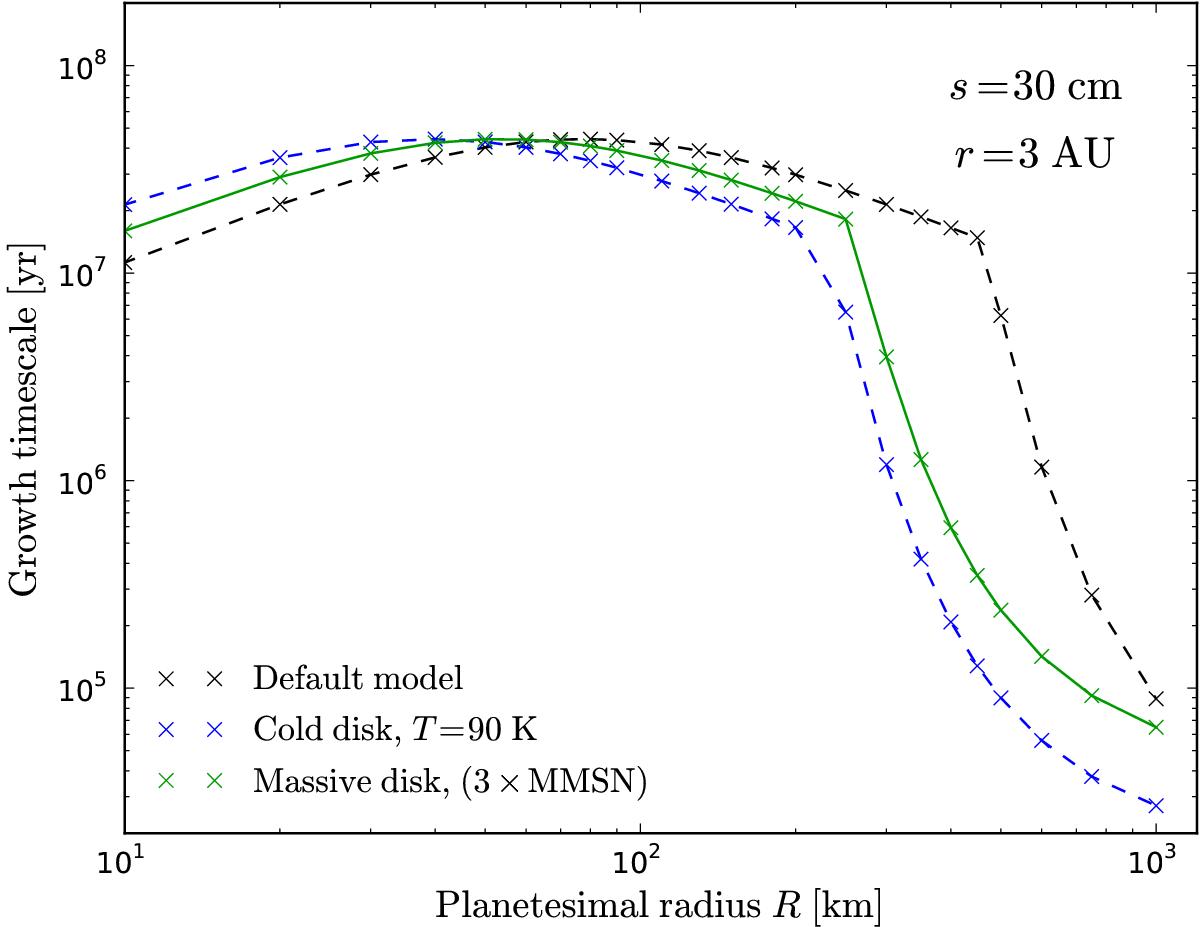
Growth timescale tgrowth for a pebble of radius s = 30 cm as function of planetesimal radius R at 3 AU. The black dashed curve shows the default model (as in Fig. 4). The other curves consecutively give the effects of a colder disk resulting in a headwind of vhw = 28 cm s-1 (blue dashed line) and a threefold increase in gas density (green curve) with a −0.5 power-law index for the surface density (Eq. (3)). The crosses represent numerical results and the solid (and dashed) lines represent fits.
Current usage metrics show cumulative count of Article Views (full-text article views including HTML views, PDF and ePub downloads, according to the available data) and Abstracts Views on Vision4Press platform.
Data correspond to usage on the plateform after 2015. The current usage metrics is available 48-96 hours after online publication and is updated daily on week days.
Initial download of the metrics may take a while.