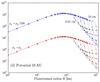
Fig. 4
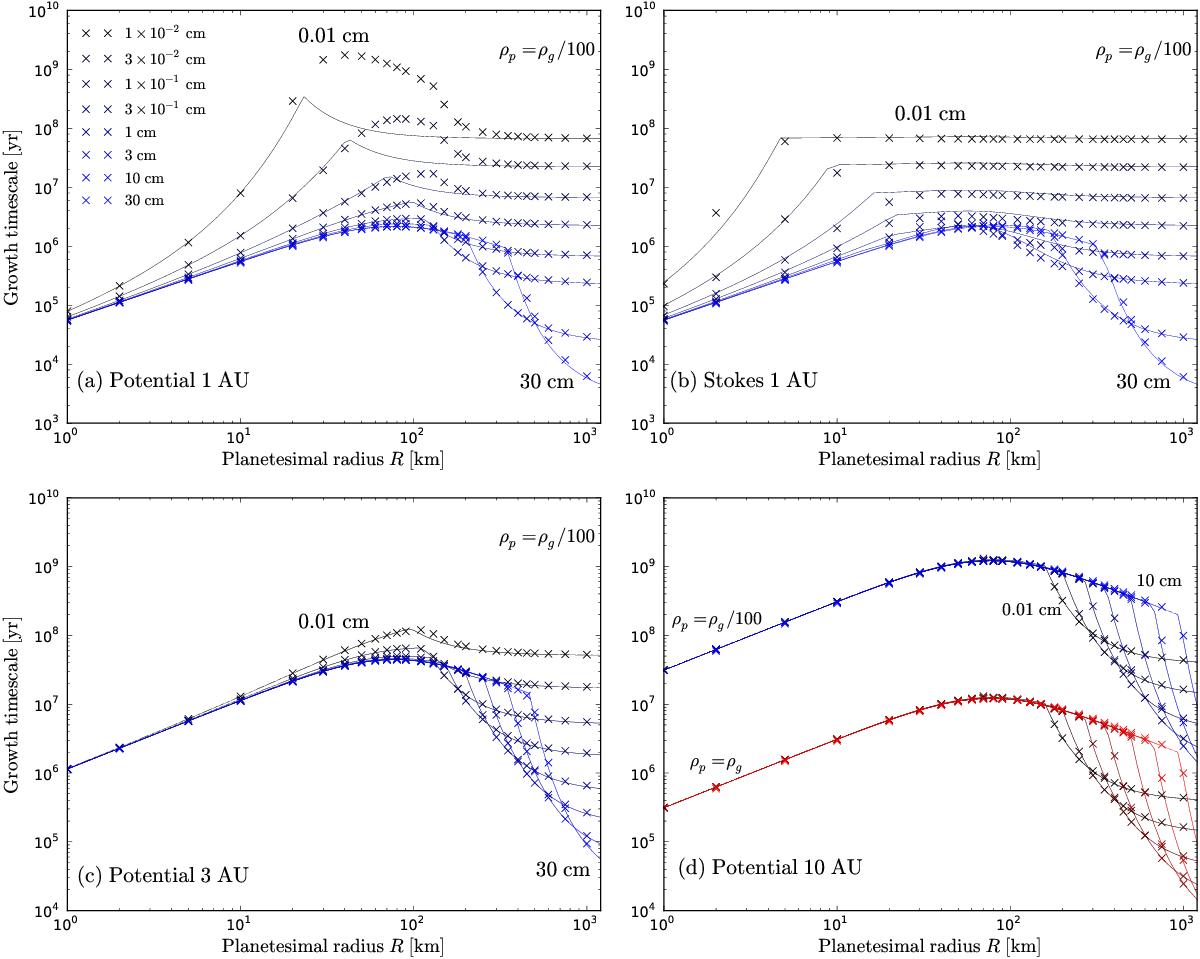
Growth timescale tgrowth as function of planetesimal radius R for a constant internal density ρ• = 1 g cm-3. Crosses indicate numerical data, while the solid lines are fits. The color scale extends from dark blue to light blue, transitioning from lowest particle radius to highest particle radius. a) tgrowth obtained with the potential flow solution at 1 AU orbital distance and a pebble density of ρp = ρg/ 100, showing maxima at Rgr,max ~ 100 km. b) tgrowth with the Stokes flow solution at 1 AU orbital distance and a pebble density of ρp = ρg/ 100 , showing early settling and flattening out of the curves. c) tgrowth with the potential flow solution at 3 AU orbital distance and a pebble density of ρp = ρg/ 100. d) tgrowth with the potential flow solution at 10 AU orbital distance and a pebble density of ρp = ρg/ 100 (top, blue) and a pebble density of ρp = ρg (bottom, red).
Current usage metrics show cumulative count of Article Views (full-text article views including HTML views, PDF and ePub downloads, according to the available data) and Abstracts Views on Vision4Press platform.
Data correspond to usage on the plateform after 2015. The current usage metrics is available 48-96 hours after online publication and is updated daily on week days.
Initial download of the metrics may take a while.