| Issue |
A&A
Volume 586, February 2016
|
|
|---|---|---|
| Article Number | L8 | |
| Number of page(s) | 6 | |
| Section | Letters | |
| DOI | https://doi.org/10.1051/0004-6361/201527264 | |
| Published online | 04 February 2016 | |
A narrow, edge-on disk resolved around HD 106906 with SPHERE⋆,⋆⋆
1 Univ. Grenoble Alpes, Institut de Planétologie et d’Astrophysique de Grenoble (IPAG, UMR 5274), 38000 Grenoble, France
e-mail: This email address is being protected from spambots. You need JavaScript enabled to view it.
2 CNRS, Institut de Planétologie et d’Astrophysique de Grenoble (IPAG, UMR 5274), 38000 Grenoble, France
3 CRAL, UMR 5574, CNRS, Université Lyon 1, 9 avenue Charles André, 69561 Saint Genis Laval Cedex, France
4 Aix Marseille Université, CNRS, LAM (Laboratoire d’Astrophysique de Marseille) UMR 7326, 13388 Marseille, France
5 INAF−Osservatorio Astronomico di Padova, Vicolo dell’Osservatorio 5, 35122 Padova, Italy
6 European Southern Observatory, Alonso de Cordova 3107, Casilla 19001 Vitacura, Santiago 19, Chile
7 Max Planck Institut für Astronomie, Königstuhl 17, 69117 Heidelberg, Germany
8 Instituto de Física y Astronomía, Facultad de Ciencias, Universidad de Valparaíso, Av. Gran Bretaña 1111, Playa Ancha, Valparaíso, Chile
9 ICM nucleus on protoplanetary disks, Universidad de Valparaíso, Av. Gran Bretaña 1111, Valparaíso, Chile
10 Steward Observatory, Department of Astronomy, University of Arizona, 933 North Cherry Avenue, Tucson, AZ 85721-0065, USA
11 LESIA, Observatoire de Paris, CNRS, Université Paris Diderot, Université Pierre et Marie Curie, 5 place Jules Janssen, 92190 Meudon, France
12 UMI-FCA, CNRS/INSU (UMI3386), France
13 Sterrewacht Leiden, PO Box 9513, Niels Bohrweg 2, 2300 RA Leiden, The Netherlands
14 Institute for Astronomy, ETH Zurich, Wolfgang-Pauli-Strasse 27, 8093 Zurich, Switzerland
15 Geneva Observatory, University of Geneva, Ch. des Maillettes 51, 1290 Versoix, Switzerland
16 Department of Astronomy, Stockholm University, AlbaNova University Center, 106 91 Stockholm, Sweden
17 Observatoire de Haute-Provence, OH/CNRS, 04870 St. Michel l’ Observatoire, France
18 Laboratoire Lagrange, Université de Nice-Sophia Antipolis, Observatoire de la Côte d’Azur, CNRS UMR 7293, Nice Cedex 44, France
19 Onera−The French Aerospace Lab, 92322 Châtillon, France
Received: 28 August 2015
Accepted: 28 September 2015
Abstract
Context. HD 106906AB is the only young binary system so far around which a planet has been imaged and a debris disk has been shown to exist, thanks to a strong IR excess. As such, it represents a unique opportunity for studying the dynamics of young planetary systems.
Aims. We aim at further investigating the close (tens of au scales) environment of the HD 106906AB system.
Methods. We used the extreme adaptive-optics-fed, high-contrast imager SPHERE that has recently been installed on the VLT to observe HD 106906. Both the IRDIS imager and the Integral Field Spectrometer were used.
Results. We discovered a highly inclined, ring-like disk at a distance of 65 au from the star. The disk shows a strong brightness asymmetry with respect to its semi-major axis. It shows a smooth outer edge, compatible with ejection of small grains by the stellar radiation pressure. We show furthermore that the planet’s projected position is significantly above the PA of the disk. Given the determined disk inclination, it is not excluded, however, that the planet could still orbit within the disk plane if at a large separation (2000−3000 au). We identified several additional point sources in the SPHERE/IRDIS field of view that appear to be background objects. We compare this system with other debris disks sharing similarities, and we briefly discuss the present results in the framework of dynamical evolution.
Key words: techniques: high angular resolution / stars: individual: HD 106906 / planetary systems
Based on data obtained with the VLT/Sphere at Paranal. Programme: 095.C-0298(A).
This work is based (in part) on data products produced at the SPHERE Data Center hosted at OSUG/IPAG, Grenoble.
© ESO, 2016
1. Introduction
Circumbinary planets offer valuable constraints on planet formation theories (Thalmann et al. 2014). Very few long-period circumbinary planets are known today. One of them is HD 106906, a Lower Centaurus Crux (LCC) member that hosts a massive (M = 11 ± 2MJup ) giant planet (GP) detected in projected separation at 650 au by Bailey et al. (2014). We recently demonstrated that HD 106906 is a close binary, therefore named HD 106906AB, with a total stellar mass probably greater than 2.5 M⊙ (Lagrange et al. 2016). In addition, a high-luminosity (Ld/L∗ = 1.4 × 10⁻³) circumbinary disk, indicatedby the near-infrared and far-infrared SPITZER data, is also present (Chen et al. 2005), and the dynamical relation between the planet and the disk is therefore unknown. Given its youth (13 ± 2 Myr; Pecaut et al. 2012), this system offers unique opportunities to study early dynamics of planetary systems. A very interesting related question is where and how the planet formed. If formed close to the star by core accretion or disk gravitational instability, some mechanisms had to eject it onto its current orbit, without destroying the disk material that is assumed to be located at ≃ 20 au. If formed bound to the star at its present location, an alternative formation mechanism needs to be invoked, such as cloud collapse. Alternatively, the planet may have been captured from another star. This is a plausible scenario as the large-scale (cluster) environment of HD 106906AB is and was certainly even denser at earlier ages (for a discussion, see Lagrange et al. 2016). Two related key questions are the position of the planet with respect to the disk, and the disk morphological properties.
Observing log.
As part of a large survey to search for planets around members of young and nearby associations, we recently recorded high-contrast images of HD 106906AB with the SPHERE instrument that has recently been mounted on ESO’s VLT Unit Telescope 3 (Beuzit et al. 2008). The data resolve the disk for the first time and constrain the planet position relative to the disk. They also allow precisely constraining the GP population around the binary. This Letter aims at presenting the observational results and developing qualitative arguments on the system. We first describe the data and the observations (Sect. 2), then the results obtained on the disk (Sect. 3), the planet position relative to the disk (Sect. 4), and the search for additional planets in the system (Sect. 5).
2. Data
2.1. Data log
Various images of HD 106906AB were recorded in March, May, and July, 2015 with different instrumental setups (see Table 1). Exposures were taken in May at H band and in H2H3 dual-band imaging (centered at 1.59 and 1.67 μm, respectively; Vigan et al. 2010) with the IRDIS camera (Dohlen et al. 2008), and at YJ (0.95−1.35 μm, spectral resolution R ≃ 54) with the Integral Field Spectrometer (IFS; Claudi et al. 2008). We note that these observations are unpolarized. In July, additional data were recorded in dual-band imaging at K1K2 (centered at 2.11 and 2.25 μm) with IRDIS and at YH (0.95−1.65 μm, R ≃ 33) with IFS. In all these observations, we used an apodized Lyot coronagraph including a 185 mas focal mask (SPHERE mask N_ALC_YJH_S) as well as a pupil mask. IRDIS provides a ≃12′′× 12′′field of view (FoV; 1100 × 1100 au, given the star’s distance 92.1 pc; van Leeuwen 2007), with a ≃12.2 mas/pixel scale. An IFS dataset consists of 21 000 spectra spread over 5.1 × 41 pixels on the detector. After extraction, the FoV is 1.7′′× 1.7′′and the spaxel size is 7.4 × 7.4 mas, that is, 0.68 × 0.68 au.
The coronagraphic observations were performed keeping the pupil stabilized so as to perform angular differential imaging (ADI) post-processing (Marois et al. 2006). This allows suppressing a large portion of the residual starlight after the coronagraph. The FoV rotations for the different sets of data are provided in Table 1. Our observing sequence was as follows: 1) Point spread function (PSF) imaging, with HD 106906AB offset from the mask, so as to record a PSF and a relative photometric calibration; 2) image of the star behind the mask, with four satellite footprints of the PSF that can be used for fine monitoring of the centering; 3) coronagraphic sequence; 4) image of the star behind the mask, with four satellite footprints again; 5) PSF imaging; and 6) sky observations, with DITs corresponding to the DITs of the coronagraphic sequence. Finally, the true North (TN) and plate scales were measured using astrometric calibrators observed during each run, as part of the SPHERE GTO survey (Maire et al. 2016). They are reported in Table 1. We note that the plate scales and TN values were measured on non-coronagraphic data. A shift of about 0.02 mas/pixel in plate scale has been found empirically between the non-coronographic and coronagraphic data. For this reason, we used conservative error bars below to measure the separation.
2.2. Data reduction
When observing with IRDIS in dual imaging at H2H3 (resp. K1K2), IRDIS produces two simultaneous images, the left one at H2 (resp. K1) and the right one at H3 (resp. K2). In classical imaging broadband H, two identical images are taken on the left and on the right detector quadrants. The IRDIS data were corrected for cosmetics and sky background using the SPHERE data reduction and handling (DRH) pipeline (Pavlov et al. 2008). The outputs include cubes of left and right images recentered onto a common origin using the satellite spots that were also corrected for distortion. After these first steps, the data were sorted out according to their quality, and the following algorithms were applied:classical angular differential imaging (cADI, Marois et al. 2006), template locally optimized combination of images (TLOCI, Marois et al. 2014), and principal component analysis (PCA, Soummer et al. 2012). To do so, we used an analysis pipeline that we had developed to reduce and analyze our guaranteed time observations. The IFS data were also preprocessed using the DRH pipeline; then they were processed with PCA as described in Mesa et al. (2015). For the May sequences, the data were median-binned in 16 (May 12) and 14 (May 6) data cubes before reduction.
3. A disk around HD 106906AB
All IRDIS datasets (even the poor-quality set of March 30) and reductions reveal a disk seen close to edge-on. A set of resulting median images obtained using different algorithms is shown in Fig. 1. The IFS image resulting from the data of May 12 is shown in Fig. 2. The later image is a median over wavelength of the image obtained with PCA (with 50 components). A low-pass median filter (size of 31 pixels) and a software mask leaving the ring between 12 (0.09′′) and 108 pixels (0.81′′) from field center were used.
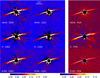 |
Fig. 1 From left to right: CADI, LOCI, and PCA of the HD 106906AB disk at (from top to bottom) H2+H3, H and K1K2 bands (IRDIS data). North is up and east is to the left. The FoV of each image is 2.4′′× 1.8′′. The intensity scale of the top right image has been adapted to highlight the southern part of the disk. |
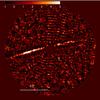 |
Fig. 2 IFS YJH snr map of the HD 106906AB disk. N is up and E to the left. |
3.1. Disk properties
In our images, the disk appears mostly as a ring structure with a brightness distribution peaking at about 65 au, which is much farther away than inferred from modeling the spectral energy distribution under the assumption of pure blackbody grains (20 au, Bailey et al. 2014). It is detected out to 110 au in our images and is elongated in the SE-NW direction. Its northern side is much brighter than the southern side, which is not detected with all the reduction algorithms. Given the age of the system as well as the absence of significant amounts of circumstellar gas and because of its similarity with other debris disks (see below), we can safely conclude that the disk is a debris disk.
A full modeling of the disk is beyond the scope of this Letter. We nonetheless performed a simple forward modeling of the disk images as was done in Milli et al. (2012) using the GRATER code (Augereau et al. 1999) to constrain the disk morphology and separate ADI artifacts from real features. We modeled the disk as an inclined optically thin ring, centered on the star, with a dust density distribution that peaks at a radius r0 and follows a power law of slope αin within r0 and αout beyond r0. The model geometry is defined by six free parameters: the inclination i, the position angle (PA), the radius of peak dust density r0, the Henyey-Greenstein coefficient g parametrizing the anisotropy of scattering, the outer slope αout, and a scaling factor to match the disk total flux. We fixed the inner slope αin to 10 because our images are unable to constrain this parameter. Likewise, the vertical dust density distribution was set to a Gaussian profile of scale height 0.5 au at r0 with a linear flaring. For each set of data, the disk model was rotated to the appropriate parallactic angles, convolved with the instrumental PSF and subtracted from each frame. The resulting data cube was reduced using the same PCA algorithm as described previously, retaining eight components for the PSF subtraction. These steps were repeated by varying the free parameters until a reduced chi-squared is minimized. The reduced chi-squared was computed in an elliptical annulus where the disk was detected. The result of this minimization is given in Table 2. We derive an inclination of 85.3 ± 0.1 deg, a disk position angle (PA) of 104.4 ± 0.3 deg, a Henyey-Greenstein parameter of anisotropy g of 0.6 ± 0.1. We also performed a simple elliptical fit on the IRDIS data, which gave similar values for the inclination and PA. The disk is strongly forward scattering. Finally, the inversion leads to a slope of −4 for the outer edge of the ring.
Best model parameters for the HD 106906 disk after forward modeling.
Morphological properties of the disks of HD 106906, HR4796, HD15115, HD61005, and β Pictoris .
A remarkable feature of the disk is its E-W brightness asymmetry, as clearly seen in Figs. 1−3, where we show the brightness distribution along the southeast and northwest ansae as measured on the H2+H3+K1+K2 image. The SE side appears to be about 10% brighter than the NW side. Our simple symmetric model is not able to fully account for this brightness asymmetry. This asymmetry could be explained by an elliptic disk, with a pericenter located on the NW side (but see also below).
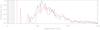 |
Fig. 3 Disk brightness along the semi-major axis, extracted from H2+H3+K1+K2 data (see text). To improve the S/N, we averaged the flux over three pixels perpendicular to this axis. The black curve corresponds to the east, the red curve to the west side. |
3.2. Comparison with other debris disks
The disk of HD 106906AB shows similarities with the disk of HR4796 (Schneider et al. (2009), Lagrange et al. (2012c), see also Milli et al. 2015, and in prep.): they both present rings with an inner void, with similar distances and widths (Table 3). Their outer edges are quite different, however: while the HR4796 disk brightness slope is about −10, the HD 106906AB disk is −4, that is, more similar to that of the β Pictoris disk (Lagrange et al. 2012a). A full disk modeling of the β Pictoris system, including radiation pressure acting on the small grains produced by collisions, reproduced most of the disk asymmetries (Augereau et al. 2001). For HR4796, the steep edge is not fully understood; it may either imply the presence of a companion close to the outer disk, or be due to a higher opacity in the HR4796 disk that partly blocks the stellar flux (for a detailed discussion, see Lagrange et al. 2012c).
Neither the β Pictoris disk nor the HR4796 disk show strong side asymmetries, as does the disk of HD 106906AB. The disk around the F2V star HD 15115 (see also Table 3) is more similar from this point of view (Mazoyer et al. 2014), with asymmetries along both the minor and major axes. Possible explanations of the asymmetry along the semi-major axis include interactions with the interstellar medium, perturbation by a possible neighbor star (HIP 12545), or intrinsic disk properties. The disk of HD 15115 is bowed (see Rodigas et al. 2012); such a bow might be present in HD 106906 data, but the data are not good enough to allow a firm conclusion at this point.
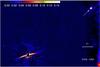 |
Fig. 4 Disk and the planet around HD 106906AB. North is up and east is to the left. HD 106906AB b is the bright source in the top right corner. |
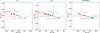 |
Fig. 5 From left to right: in blue, HD 106906AB b, relative positions of stars 1 and 3 with respect to their positions at the first epoch (2004/01/12). The 2015 positions are given in this paper, and the other positions are taken from Bailey et al. (2014). The curve shows the expected motion if the targets are background objects. In red, the expected positions, assuming the targets are background targets, at each epoch. We adopted very conservative error bars (30 mas) for all datasets in this diagram because of the uncontrolled variations during the exposures. |
A comparison with the disk of the solar-type star HD 61005 (Hines et al. 2007) is interesting because the disk also has a narrow ring-like shape, with a sharp inner edge. Brightness asymmetries are also detected along the semi-major and semi-minor axes. An extending, tenuous feature is seen to emerge from the ring, possibly due to interactions with a warm low-density cloud (Maness et al. 2009). Such extended features are not detected in our data.
The HD 106906 system is the second known system with a resolved disk and an imaged planet; the other is the β Pictoris system1. In both cases, the planet is a massive giant and the disk bulk of material lies at a few tens of aus. In both cases, the inner part of the disk shows a relative void of material. The host stars are both early-type, massive, young stars. But while HD 106906AB b is orbiting at more than 600 au, β Pictoris b orbits at less than 10 au. The dynamical histories of these planets and their formation histories might be different.
4. Position of the planet relative to the disk
HD 106906AB b is located more than 7′′ away from the central stars in projected separation (Bailey et al. 2014). With this separation, the planet is at the edge of our IRDIS FoV. We therefore carefully scheduled a series of observations to image both the disk and the planet on the same frames, to measure the planet PA relative to the disk PA as precisely as possible using a single dataset. Indeed, when comparing PA coming from different instruments or telescopes, the systematics due to TN can be very high, as demonstrated in Lagrange et al. (2012a). These observations yielded a timing constraint to ensure that the planet would be crossing the detector FoV in pupil-tracking mode and to also ensure a large enough FoV rotation. The image resulting from this set of observations is shown in Fig. 42. Based on the NICI and HST ACS data, we confirm that HD 106906AB b shares a common proper motion with the central stars (see Fig. 5 and Table 4).
The first question addressed is whether the planet could still be orbiting within the disk, even though it is seen 23 degrees above the disk in projected position. Assuming a disk inclination of id and a difference between the disk and the planet PA of ip, then the planet could still be within the disk if it is located 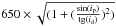 au from the central stars. With id = 5° (resp. 7°), its physical separation to the central star would be ≃3000 (resp. 2000) au. Then, the planet could still be within the disk plane if located at a much larger distance than the projected separation. We note that even if, in contrast, the real inclination of HD 106906AB b is 23 degrees with respect to the disk, the planet would not induce Kozai resonance effects on the disk, regardless of its orbital properties. For most three-body systems, the Kozai mechanism starts only above a mutual inclination of around 40° (see Ford et al. 2000, and references therein). Whether the planet may be causing the observed disk asymmetry through regular perturbations is unclear. To answer this question, we would need to know the planet orbital properties, which are obviously be difficult to obtain. We conclude that even if complex, the stability of the binary + disk + planet system is probably not a problem. The binary is very tight, which means that it acts as a single massive central star at the distance of the inner ring. Moreover, as we showed above, if the orbit of HD 106906AB b is not coplanar with the disk, it probably will not destroy the disk provided its orbit is not too eccentric. To account for the inner edge of the disk, additional companions or other dynamic processes need to be invoked.
5. Search for other planets
Our IRDIS images reveal three additional point sources in the H2H3, H, or K1K2 FoV (see Table 4). Two of them (stars 1 and 2) were already present in ancillary HST ACS data (taken in 2004) and in the NICI planet b discovery images (taken in 2011). Given the long time span between the HST data (taken in 2004) and the present SPHERE data and given the HD 106906AB ppm, we could easily check that these sources do not share a common proper motion with HD 106906AB (see Fig. 5). Star 33, located closer to the star, was not detected in NICI or ACS data. Finally, another very faint target is detected in the H images south of star 3; this was not present in the HST or NICI data. No point source was identified in the IFS FoV.
Stars and planets around HD 106906AB.
Using the SPHERE IRDIS and IFS data, we computed the contrasts achieved in these observations. We then translated these contrasts into masses, using the BT-Settl + COND interior models adapted to the SPHERE filters and assuming an age of 10 Myr. The results are summarized in Fig. 6. The extinction toward HD 106906AB is negligible (AV = 0.04 ± 0.02, Pecaut et al. 2012). We exclude companions with masses 1 MJup or more at projected separations 200 au or more, planets with masses in the range 1−2 MJup between 100 and 200 au, planets more massive than 3 MJup within 30−100 au, and planets more massive than 10 MJup in the range 10−30 au. These limits are significantly improved with respect to those (5−7 MJup farther away than about 40 au) obtained with the Clio L’ data (Bailey et al. 2014). Additional massive inner planets are still not excluded; they may be responsible for the inner void of material within the disk. They also leave room for additional planets that could be responsible for the inner edge if they orbit closer than about 10 au from the inner edge, assuming that their separation (a), eccentricity (e), mass Mp, and distance to the edge δa follow the Mustill & Wyatt (2012) criterium δa/a = 1.8e1/5 (Mp/M∗)1/5.
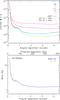 |
Fig. 6 Top: azimuthally averaged contrasts obtained with IRDIS and IFS. Bottom: best detection limits expressed in Jupiter masses. For IRDIS, the detection limits were combined to produce the best limits after they were expressed in terms of masses. |
Fomalhaut hosts a disk and a possible planet surrounded by dust, but the planet photons have not been detected yet (Kalas et al. 2008).
In practice, the planet was within the FoV in only 35 cubes of the whole dataset (consisting of 64 cubes). We selected these 35 cubes and reduced them again. We checked that the position of the planet using the extracted dataset was the same as using the whole dataset.
We label this target “star” for convenience, but we do not yet have information on its nature.
Acknowledgments
The project is supported by CNRS, by the Agence Nationale de la Recherche (ANR-14-CE33-0018), and the Programme National de Planétologie (PNP, INSU) and Programme National de Physique Stellaire (PNPS, INSU). A.L.M., D.M., and R.G. acknowledge support by Italian MIUR through “Premiale WOW 2013”. J.O. acknowledges support from the Millennium Nucleus RC130007 (Chilean Ministry of Economy). We thank P. Delorme and E. Lagadec (SPHERE Data Center) for their efficient help during the data reduction process. SPHERE is an instrument designed and built by a consortium consisting of IPAG (Grenoble, France), MPIA (Heidelberg, Germany), LAM (Marseille, France), LESIA (Paris, France), Laboratoire Lagrange (Nice, France), INAF − Osservatorio di Padova (Italy), Observatoire de Genève (Switzerland), ETH Zurich (Switzerland), NOVA (Netherlands), ONERA (France) and ASTRON (Netherlands) in collaboration with ESO. SPHERE was funded by ESO, with additional contributions from CNRS (France), MPIA (Germany), INAF (Italy), FINES (Switzerland) and NOVA (Netherlands). SPHERE also received funding from the European Commission Sixth and Seventh Framework Programmes as part of the Optical Infrared Coordination Network for Astronomy (OPTICON) under grant number RII3-Ct-2004-001566 for FP6 (2004−2008), grant number 226604 for FP7 (2009−2012) and grant number 312430 for FP7 (2013−2016).
References
- Augereau, J. C., Lagrange, A. M., Mouillet, D., Papaloizou, J. C. B., & Grorod, P. A. 1999, A&A, 348, 557 [NASA ADS] [Google Scholar]
- Augereau, J. C., Nelson, R. P., Lagrange, A. M., Papaloizou, J. C. B., & Mouillet, D. 2001, A&A, 370, 447 [NASA ADS] [CrossRef] [EDP Sciences] [Google Scholar]
- Bailey, V., Meshkat, T., Reiter, M., et al. 2014, ApJ, 780, L4 [Google Scholar]
- Beuzit, J.-L., Feldt, M., Dohlen, K., et al. 2008, in SPIE Conf. Ser., 7014 [Google Scholar]
- Buenzli, E., Thalmann, C., Vigan, A., et al. 2010, A&A, 524, L1 [NASA ADS] [CrossRef] [EDP Sciences] [Google Scholar]
- Chen, C. H., Jura, M., Gordon, K. D., & Blaylock, M. 2005, ApJ, 623, 493 [NASA ADS] [CrossRef] [Google Scholar]
- Claudi, R. U., Turatto, M., Gratton, R. G., et al. 2008, in SPIE Conf. Ser., 7014, 3 [Google Scholar]
- Desidera, S., Covino, E., Messina, S., et al. 2011, A&A, 529, A54 [NASA ADS] [CrossRef] [EDP Sciences] [Google Scholar]
- Dohlen, K., Langlois, M., Saisse, M., et al. 2008, in SPIE Conf. Ser., 7014, 3 [Google Scholar]
- Ford, E. B., Kozinsky, B., & Rasio, F. A. 2000, ApJ, 535, 385 [NASA ADS] [CrossRef] [Google Scholar]
- Hines, D. C., Schneider, G., Hollenbach, D., et al. 2007, ApJ, 671, L165 [NASA ADS] [CrossRef] [Google Scholar]
- Kalas, P., Fitzgerald, M. P., & Graham, J. R. 2007, ApJ, 661, L85 [NASA ADS] [CrossRef] [Google Scholar]
- Kalas, P., Graham, J. R., Chiang, E., et al. 2008, Science, 322, 1345 [NASA ADS] [CrossRef] [PubMed] [Google Scholar]
- Lagrange, A.-M., Boccaletti, A., Milli, J., et al. 2012a, A&A, 542, A40 [NASA ADS] [CrossRef] [EDP Sciences] [Google Scholar]
- Lagrange, A.-M., De Bondt, K., Meunier, N., et al. 2012b, A&A, 542, A18 [NASA ADS] [CrossRef] [EDP Sciences] [Google Scholar]
- Lagrange, A.-M., Milli, J., Boccaletti, A., et al. 2012c, A&A, 546, A38 [NASA ADS] [CrossRef] [EDP Sciences] [Google Scholar]
- Lagrange, A.-M., Mathias, P., Absil, O., et al. 2016, A&A, submitted [Google Scholar]
- Maire, A.-L., Bonnefoy, M., Ginski, C., et al. 2016, A&A, in press, DOI: 10.1051/0004-6361/201526594 [Google Scholar]
- Maness, H. L., Kalas, P., Peek, K. M. G., et al. 2009, ApJ, 707, 1098 [NASA ADS] [CrossRef] [Google Scholar]
- Marois, C., Lafrenière, D., Doyon, R., Macintosh, B., & Nadeau, D. 2006, ApJ, 641, 556 [Google Scholar]
- Marois, C., Correia, C., Véran, J.-P., & Currie, T. 2014, in IAU Symp. 299, eds. M. Booth, B. C. Matthews, & J. R. Graham, 48 [Google Scholar]
- Mazoyer, J., Boccaletti, A., Augereau, J.-C., et al. 2014, A&A, 569, A29 [NASA ADS] [CrossRef] [EDP Sciences] [Google Scholar]
- Mesa, D., Gratton, R., Zurlo, A., et al. 2015, A&A, 576, A121 [NASA ADS] [CrossRef] [EDP Sciences] [Google Scholar]
- Milli, J., Mouillet, D., Lagrange, A.-M., et al. 2012, A&A, 545, A111 [NASA ADS] [CrossRef] [EDP Sciences] [Google Scholar]
- Milli, J., Mawet, D., Pinte, C., et al. 2015, A&A, 577, A57 [NASA ADS] [CrossRef] [EDP Sciences] [Google Scholar]
- Mustill, A. J., & Wyatt, M. C. 2012, MNRAS, 419, 3074 [NASA ADS] [CrossRef] [Google Scholar]
- Pavlov, A., Möller-Nilsson, O., Feldt, M., et al. 2008, in SPIE Conf. Ser., 7019, 39 [Google Scholar]
- Pecaut, M. J., Mamajek, E. E., & Bubar, E. J. 2012, ApJ, 746, 154 [NASA ADS] [CrossRef] [Google Scholar]
- Rodigas, T. J., Hinz, P. M., Leisenring, J., et al. 2012, ApJ, 752, 57 [NASA ADS] [CrossRef] [Google Scholar]
- Schneider, G., Weinberger, A. J., Becklin, E. E., Debes, J. H., & Smith, B. A. 2009, AJ, 137, 53 [NASA ADS] [CrossRef] [Google Scholar]
- Soummer, R., Pueyo, L., & Larkin, J. 2012, ApJ, 755, L28 [NASA ADS] [CrossRef] [Google Scholar]
- Stauffer, J. R., Hartmann, L. W., & Barrado y Navascues, D. 1995, ApJ, 454, 910 [NASA ADS] [CrossRef] [Google Scholar]
- Thalmann, C., Desidera, S., Bonavita, M., et al. 2014, A&A, 572, A91 [NASA ADS] [CrossRef] [EDP Sciences] [Google Scholar]
- van Leeuwen, F. 2007, A&A, 474, 653 [NASA ADS] [CrossRef] [EDP Sciences] [Google Scholar]
- Vigan, A., Moutou, C., Langlois, M., et al. 2010, MNRAS, 407, 71 [NASA ADS] [CrossRef] [Google Scholar]
All Tables
Morphological properties of the disks of HD 106906, HR4796, HD15115, HD61005, and β Pictoris .
All Figures
|
Fig. 1 From left to right: CADI, LOCI, and PCA of the HD 106906AB disk at (from top to bottom) H2+H3, H and K1K2 bands (IRDIS data). North is up and east is to the left. The FoV of each image is 2.4′′× 1.8′′. The intensity scale of the top right image has been adapted to highlight the southern part of the disk. |
| In the text | |
|
Fig. 2 IFS YJH snr map of the HD 106906AB disk. N is up and E to the left. |
| In the text | |
|
Fig. 3 Disk brightness along the semi-major axis, extracted from H2+H3+K1+K2 data (see text). To improve the S/N, we averaged the flux over three pixels perpendicular to this axis. The black curve corresponds to the east, the red curve to the west side. |
| In the text | |
|
Fig. 4 Disk and the planet around HD 106906AB. North is up and east is to the left. HD 106906AB b is the bright source in the top right corner. |
| In the text | |
|
Fig. 5 From left to right: in blue, HD 106906AB b, relative positions of stars 1 and 3 with respect to their positions at the first epoch (2004/01/12). The 2015 positions are given in this paper, and the other positions are taken from Bailey et al. (2014). The curve shows the expected motion if the targets are background objects. In red, the expected positions, assuming the targets are background targets, at each epoch. We adopted very conservative error bars (30 mas) for all datasets in this diagram because of the uncontrolled variations during the exposures. |
| In the text | |
|
Fig. 6 Top: azimuthally averaged contrasts obtained with IRDIS and IFS. Bottom: best detection limits expressed in Jupiter masses. For IRDIS, the detection limits were combined to produce the best limits after they were expressed in terms of masses. |
| In the text | |
Current usage metrics show cumulative count of Article Views (full-text article views including HTML views, PDF and ePub downloads, according to the available data) and Abstracts Views on Vision4Press platform.
Data correspond to usage on the plateform after 2015. The current usage metrics is available 48-96 hours after online publication and is updated daily on week days.
Initial download of the metrics may take a while.