Fig. 7
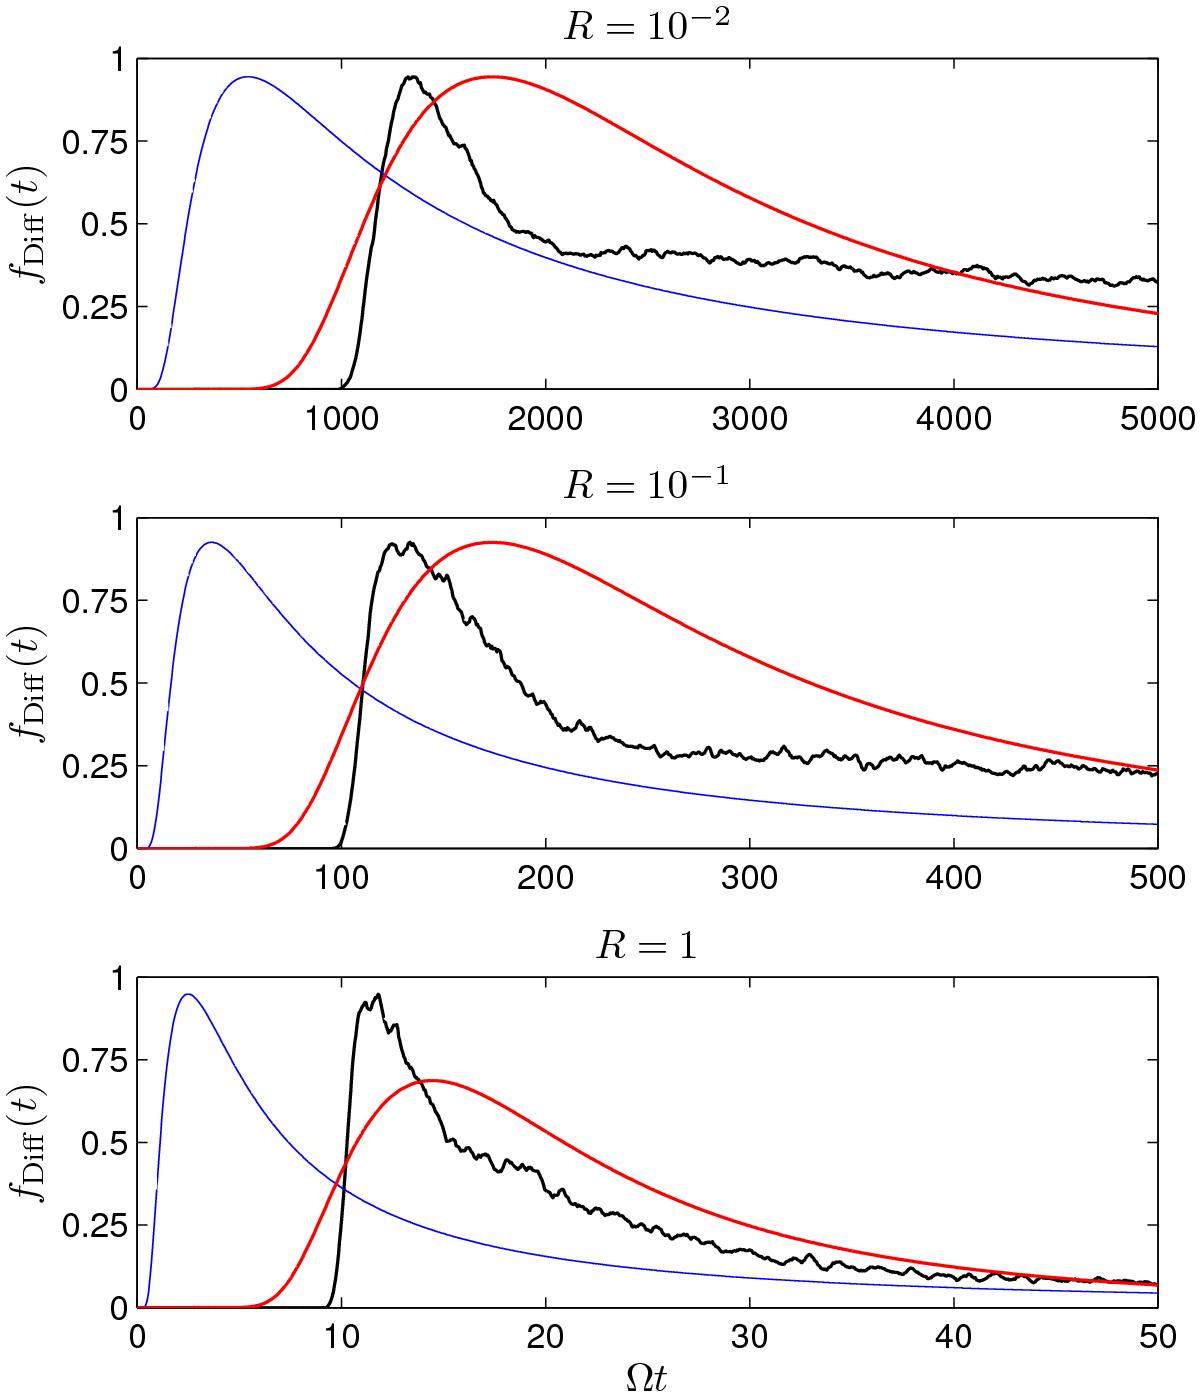
Time profile (intensity profile) in arbitrary linear units for particles with variable energies (see subplot titles). The distance between the particle origin and the virtual detector is L = 10ℓ0. The various curves are as follows: The black lines show the profile as obtained from the simulations using the methods described in Sect. 3. The red lines show the three-dimensional diffusion solution (with the normalization factor as an open parameter) from Eq. (7)using the diffusion coefficients as obtained from the simulations via the mean-square displacements. In addition, the result from Eq. (8)is shown for constant diffusion coefficients taken from the simulations (blue lines), i.e., κi(t = tmax).
Current usage metrics show cumulative count of Article Views (full-text article views including HTML views, PDF and ePub downloads, according to the available data) and Abstracts Views on Vision4Press platform.
Data correspond to usage on the plateform after 2015. The current usage metrics is available 48-96 hours after online publication and is updated daily on week days.
Initial download of the metrics may take a while.