| Issue |
A&A
Volume 586, February 2016
|
|
|---|---|---|
| Article Number | A70 | |
| Number of page(s) | 12 | |
| Section | Extragalactic astronomy | |
| DOI | https://doi.org/10.1051/0004-6361/201527146 | |
| Published online | 27 January 2016 | |
Anatomy of a blazar in the (sub-)millimeter: ALMA observations of PKS 0521-365⋆
1 Joint ALMA Observatory – ESO, Av. Alonso de Córdova, 3104 Santiago, Chile
e-mail: sleon@alma.cl
2 Bosscha Observatory and Astronomy Research Division, FMIPA, Institut Teknologi Bandung, 40132 Jawa Barat, Indonesia
3 CAUP, Porto University, 4099-002 Porto, Portugal
4 National Radio Astronomy Observatory, 520 Edgemont Rd, Charlottesville, VA 22903, USA
Received: 8 August 2015
Accepted: 2 November 2015
Aims. We aim at analyzing the (sub-)millimeter emission in a nearby blazar, PKS 0521-365, to study the synchrotron and thermal emission in the different components detected at low frequency.
Methods. We analyzed the archive public data of the ALMA Cycle 0 where PKS 0521-365 is used as a calibrator. A total of 13 projects with 23 dataset were analyzed in Bands 3, 6, and 7 and combined. The whole set of data was combined and wavelet-filtered to obtain a deep image toward PKS 0521-365, reaching a dynamic range of 47 000. The individual emission flux was measured on different dates over a period of 11 months in various components. Finally we analyzed the spectral energy distribution (SED) in each different component, including the radio jet and counter jet.
Results. The point sources detected in the field follow a similar distribution to previous studies. The blazar flux shows large variation especially in Band 3. Different components are observed: core, radio jet, and newly detected counter jet, hot spot (HS), and a disky structure roughly perpendicular to the jet. The HS emission is formed by a point source surrounded by an extended emission. The viewing angle of the jet is about 30° with a Doppler factor of δ = 1.6. The HS is at a distance of 19 kpc from the center. The SED analysis shows a strong variation in the core spectral index, especially in Band 3. The two components in the radio jet have roughly a flat spectral index in Bands 6 and 7.
Conclusions. The different weak and extended components in PKS 0521-365 are detected with the ALMA data. The analysis of both jets constrains the geometrical distance of the HS to the center. The SED presents a different shape in time and frequency for each component. Finally, a new structure is detected roughly perpendicular to the radio jet. and a thermal emission origin is currently favored. Further observations at higher spatial resolution are needed to confirm that hypothesis.
Key words: galaxies: jets / galaxies: ISM / galaxies: active / BL Lacertae objects: individual: PKS 0521-365
FITS files for all the images are only available at the CDS via anonymous ftp to cdsarc.u-strasbg.fr (130.79.128.5) or via http://cdsarc.u-strasbg.fr/viz-bin/qcat?J/A+A/586/A70
© ESO, 2016
1. Introduction
Inside the wide range of different types of active galactic nuclei (AGNs), blazars are the most powerful sources. Since they show intense emission across the electromagnetic spectrum, it is thought that this strong continuum emission is due to an ejection of relativistic plasma nearly on the line of sight. A radio jet is commonly observed in blazars at lower frequencies (Antonucci & Ulvestad 1985) and their strong flux accounts for the relativistic beaming, A blazar is then a particular case of a head-on radio galaxy from an underlying population with a spread geometry distribution of the jet (Antonucci & Ulvestad 1985; Urry & Padovani 1995) originating in an AGN and oriented nearly head-on toward the observer according to the unified scheme proposed two decades ago (e.g., Urry & Padovani 1995). The jet can be detected out to wide energy ranges (Gamma, X-ray) because of the strong beaming effect.
Blazars can be divided into two types, the low-power AGNs, mainly without broad-line regions (BLRs) and a large synchrotron break frequency (Capetti et al. 2010; Tavecchio et al. 1998), and the flat-spectrum radio quasars (FSRQs) with a lower break frequency (Maraschi & Tavecchio 2003). The first kind forms the family of BL Lac radio galaxies, which was the first of its kind to be detected (e.g., Blandford & Rees 1978). The SED of the blazar normally shows two bumps, the synchrotron bump at low energy peaking in the infrared (IR)-X-ray and the inverse Compton (IC) bump normally in γ-ray. Each bump is characterized by a peak frequency ν1 and ν2 at the peak of the emission in each regime. Fossati et al. (1998) found an anti-correlation between the peak frequency ν1 and the bolometric and synchrotron luminosity. They suggested that there is a link between the source power and the frequency peak. The sequence may match a spectroscopic one, from powerful FSRQ sources at the low-peak, high-luminosity end, and the BL Lacs with a high peak and low luminosity. The BL Lacs do not normally show signs of BLRs. It was suggested that the inverse Compton (IC) emission in FSRQ was produced through the synchrotron self-Compton (SSC) mechanism or from external seed photons from the BLRs. These photons would be up-scattered by the synchrotron electrons (e.g., Chen et al. 2012). The long-standing unified scheme for radio-loud AGN proposes that the Fanaroff-Riley I and II radio galaxies (Fanaroff & Riley 1974) are the underlying progenitors of BL Lacs and FSRQs galaxies (Bicknell 1995; Fossati et al. 1998).
In a population synthesis study, Lister & Marscher (1997) used realistic luminosity functions to show that the majority of compact extragalactic radio sources have jets with low Lorentz factors. The AGN in general and the jet in particular are known to drive the evolution of their host galaxy (Best & Heckman 2012; Khalatyan et al. 2008; Sturm et al. 2011) through a feedback mechanism of depositing energy in the interstellar medium (ISM). On a large scale, the radio jet can slow down or stop the cooling of the massive X-ray halo (Fabian 2012) that surrounds these galaxies. On the galactic scale, the jet interacts with the local ISM (molecular gas, X-ray halo, etc.), and it has been suggested that for host galaxies with a dense ISM phase, the radio jet could be completely confined to the central part with no outwards propagation (Carvalho 1998) forming compact steep spectrum galaxies. It has recently been argued (Rashed et al. 2013) that the backflow along the radio jet in the elliptical host galaxy SDSS J080800.99+483807.7 might have triggered star formation. This star formation triggering mechanism in radio galaxies has been used to explain the correlation between the radio and optical morphologies of distant 3C radio galaxies (McCarthy et al. 1987). Some of the most dramatic jet-induced star formation, with star formation rates (SFR) as high as 1000 M⊙ yr-1, is associated with very luminous radio galaxies at redshifts up to z ~ 4 (Dey et al. 1997; Bicknell et al. 2000).
One study has found a clear interaction of the radio jet and the ISM in the narrow line regions (NLRs) of Seyfert galaxies (Falcke et al. 1998). Such interactions play a major role in determining the morphology of the NLR because the radio jets sweep up and compress ambient gas, producing ordered structures with enhanced surface brightness in line emission. The nearby radio galaxy M 87 which can be classified as a BL Lac was recently found to have a giant radio-to-X-ray synchrotron (Stawarz et al. 2006). It was argued that the presence of a gaseous concentration in the central part would provoke the interaction of the jet with such a feature resulting in the formation of a stationary shock structure in the innermost parts of the M 87 jet.
The radio source PKS 0521-365 (J0522-364) is a nearby AGN (Danziger et al. 1979), and it is one of the most remarkable extragalactic objects of the southern sky because it exhibits a variety of nuclear and extra-nuclear phenomena. In this work we assume a cosmology with Ωm = 0.27, ΩΛ = 0.73, H0 = 71 km s-1 Mpc-1 (Spergel et al. 2003). At z = 0.0565, PKS 0521-365 is at a comoving radial distance of 236 Mpc and havs a linear scale size of 1.15 kpc/arcsec. Classified as a BL Lac object, it shows strong narrow and broad emission lines typical of type-1 AGNs both in the optical and the UV (Ulrich 1981; Danziger et al. 1983; Scarpa et al. 1995). The source has a prominent radio, optical, and X-ray jet (Danziger et al. 1979; Keel 1986; Falomo 1994; Macchetto et al. 1991; Scarpa et al. 1999; Birkinshaw et al. 2002), which resembles that of the nearby radio galaxy M 87 (Sparks et al. 1994).
Here we present archival ALMA observations of the radio source PKS 0521-365. We retrieved public Cycle-0 observation where PKS 0521-365 was used as calibrator in Bands 3, 6, and 7. Section 2 presents the observations and data reduction, Sect. 3 the millimeter and sub-millimeter distribution of the emission, Sect. 4 the variability in the emission. Section 5 computes the spectral index, Sect. 6 the discussion, and Sect. 7 the summary and conclusions.
2. Observations and data reduction
Publicly available data from ALMA Cycle 0 observations were used to analyze the submillimeter properties of the blazar PKS 0521-365. As shown in Table A.1, the observations span a period of about one year from 2012 January 10 to 2012 November 19. The observed frequencies go from 87.3 GHz up to 372.5 GHz, which covers Bands 3, 6, and 7. PKS 0521-365 was generally used as a bandpass calibrator for the science projects sharing the same spectral setup and were observed between two and four minutes per execution. If two ExecBlocks (hereafter EBs) were observed consecutively, we merged them in a single dataset, and the observing time was chosen as the starting time of the first EB. Each EB has four spectral windows of, generally, 2 GHz bandwidths distributed over four basebands, two in the USB window and two in the LSB window. For the flux determination of each dataset, the four spectral windows were combined, and the LSB/USB spectral windows were used to determine the spectral index α, hereafter defined as Sν ∝ να with Sν the flux density at the frequency ν, in one dataset as indicated further. Before combining the different dataset in each band, a self-calibration was performed on each of them to improve the phase and amplitude gain solutions thanks to the strong continuum emission. The effective frequency quoted for the combined bands was computed using the deconvolution CLEAN task in CASA with the multifrequency synthesis (mfs) mode (see Rau & Cornwell 2011 for details).
The two most prominent features of PKS 0521-365 are the strong core and the so-called “hot spot” (HS) located at 8.6′′ at the southeast of the core. The main properties of each dataset and the measured flux of the core and the HS are summarized in Table A.2. For the core, the flux in the central area was measured directly since the jet contribution is less than 1% of the total flux. The HS flux was measured including the pixels above 3σ of the rms in the HS area.
The self-calibrated datasets were combined in each band and imaged. A final superset of all self-calibrated dataset, called “Band 3+6+7”, was created and imaged to produce the most sensitive continuum image at an effective frequency of 221.02 GHz. The total integration time is 1.55 h with an equivalent of 66 pad positions and 2145 baselines. The self-calibration of these data allowed us to achieve a rms noise of 158 μJy, for the Band 3+6+7 with a dynamic range of 27 100 without wavelet filtering. The final spatial resolution with a natural weighting is of 0.53″ × 0.71″. It is worth noting that the Band-7 combined image has the deepest sensitivity (91 μJy), which is similar to the all-in-one combined data. The properties of the combined dataset in Bands 3, 6, 7 and 3+6+7 are summarized in Table 1, together with the HS flux that does not vary with time. Each band reaches an effective bandwidth of 27 GHz (Band 3) to 285 GHz (Band 3+6+7). The effects of the lowest spatial frequencies observed at the different bands was checked by computing the flux of the HS in Band 3 using the spatial frequencies of Band 7. The HS flux is in that case lower by 5% compared to the measured flux with the full uv-coverage. Given the calibration uncertainty we can assume safely that the differential sensitivity to spatial scales between bands is negligible in the case of the observations of PKS 0521-365.
Sets of combined data (natural weighting), together with the hot spot flux.
2.1. Wavelet filtering
The wavelet transform is a powerful signal-processing technique that provides a decomposition of the signal into elementary local contribution labeled by a scale parameter (Grossmann & Morlet 1985). They are the scalar products with a family of shifted and dilated functions of constant shape called wavelets. The data are unfolded in a space-scale representation that is invariant with respect to dilation of the signal. Such an analysis is particularly suited to studying signals that exhibit space-scale discontinuities and/or hierarchical features.
The wavelet analysis of the PKS 0521-365 datasets is performed on the combined dataset in each band after the deconvolution process using the CLEAN algorithm with natural weighting. As described in Leon et al. (2000), we use the “A trous” algorithm (see Bijaoui 1991). It allows a discrete wavelet decomposition to be obtained within a reasonable CPU time. The kernel function Bs(x,y) for the convolution is a B3 spline function.
The wavelet transform (WT) W(i,x,y) of the image I(x,y) is then obtained from the following steps:
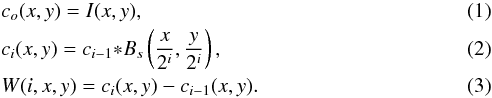 The last plane, called the last smoothed plane (LSP), is the residuals of the last convolution and not a wavelet plane, but for convenience we speak of wavelet plane for all these planes. Each plane W(i,x,y) represents the details of the image on the scale i. A wavelet plane i has a spatial resolution of 0.86 × 2i pixels, which translates into 0.21′′ in Band 3 and 0.08′′ in Bands 6 and 7 and combined for the wavelet plane 0.
Then each component of the raw map W(i,x,y) was filtered above a given threshold β, using the rms noise σi on each wavelet scale i to get the filtered wavelet planes Wf(i,x,y) of the radio continuum distribution in the different bands: 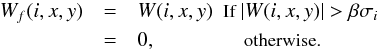 In this study the wavelet coefficients are filtered at the 4.5σ level. After WT filtering for the continuum distribution in the different bands, the actual dynamic range increases in the different filtered sets of data. Thus the combined Band 3+6+7, after WT filtering, has a dynamic range of 47 000 and the combined Band 7 reaches a dynamic range of 40 000. By combining the wavelet scales, one can achieve a different spatial resolution with a specific rms noise. Since the contribution of an image I is spread over the different spatial scales, the reconstruction through a limited set of wavelet scales is a lower limit to the total emission contribution. That effect is visible in Table 2 where the core flux is computed for the different wavelet reconstructions. A final equivalent rms noise of 90 μJy, can be achieved for the Band 3+6+7. It is worth noting that the “A trous” wavelet decomposition is not strictly orthogonal, and the spatial scale contribution can be spread over different wavelet scales. But the algorithm has a quasi-isotropic kernel that makes the physical analysis of each scale easier to perform. In our notation of the WT for the continuum images, Scale 0 has the highest spatial resolution, and Scale 7 is the LSP. The maximum scale was chosen to be 7 since the largest wavelet scales do not give basic information.
Properties of different wavelet reconstruction of the Band 3+6+7 combined and WT filtered at 4.5σ.
3. (Sub-)millimeter distribution
To analyze the submillimeter emission toward PKS 0521-365, the point source distribution was searched in that field. The point sources were searched in the Band 3+6+7 WT-filtered field with an effective rms noise of 90 μJy. The list of the point sources was obtained by using the SExtractor software (Bertin & Arnouts 1996) at a 4.5σ level with a minimum of five pixels per source to avoid spurious detections. A total of 16 sources are detected in a 1′ × 1′ box, and their properties are listed in Table A.3. A few sources are associated with the continuum emission in PKS 0521-365, and most of them should be related to background sources as shown on Fig. 1.The maximum peaks detected in the psf image were compared with the point sources, and no correlation was found. Sources #10 and #12 are associated with the core and the HS emission, respectively. It is important to note that the spatial distribution of these sources are not clustered on the radio continuum emission of PKS 0521-365 but instead uniform through the Band 3+6+7 field. Because of the rms noise of 90 μJy, in the WT-filtered Band 3+6+7 field, we can estimate the number of sources with a flux greater than 0.5 mJy to be S( > 0.5mJy)~5760deg-2. An estimation of the cumulative count at 221 GHz is given in Fig. 2 between fluxes of 0.1 mJy and 3 mJy. This estimation does not fully address the completeness of the detection and the possible spurious detections and bias. But we note that this estimation is similar to, but lower than the one derived by Hatsukade et al. (2013) using ALMA fields at 238 GHz. Figure 3 shows the emission of Bands 6 and 7 by selecting the wavelet Planes 2 to 4, which biases the slightly extended emission. Analyzing the point sources is beyond the scope of this article.
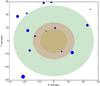 |
Fig. 1 Point sources detected in the combined field of Bands 3, 6, and 7 (νeff = 221.02 GHz) after WT filtering at 4.5σ. The symbols are proportional to the flux. The field is centered on PKS 0521-365. The colored circles represent the primary beamsize of each band. |
 |
Fig. 2 Cumulative number count at 221 GHz in a field of 1′ × 1′ between fluxes of 0.1 mJy and 3 mJy. The effective rms noise in the WT-filtered image is 100 μJy. |
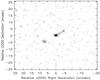 |
Fig. 3 Contour levels at [4, 4.5, 5, 5.5, 6]σ of the B6+B7 WT for the scales 2 to 4. The image is the Band 7 emission. |
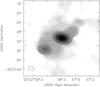 |
Fig. 4 Continuum emission toward PKS 0521-365 in Band 3 (νeff = 100.43 GHz) after filtering at 4.5σ using a WT. The contours are at [3, 5, 7, 9, 11, 15, 20, 30, 40, 50, 100, 200, 1000, 5000]σ for an rms noise of 306 μJy. |
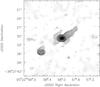 |
Fig. 5 Continuum emission toward PKS 0521-365 in Band 6 (νeff = 237.06 GHz) after filtering at 4.5σ using a WT. The contours are at [3, 4, 5, 7, 9, 11, 15, 20, 30, 40, 50, 100, 200, 1000, 5000]σ for an rms noise of 147 μJy. |
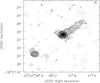 |
Fig. 6 Continuum emission toward PKS 0521-365 in Band 7 (νeff = 336.44 GHz) after filtering at 4.5σ using a WT. The contours are at [3, 4, 5, 7, 9, 11, 15, 20, 30, 40, 50, 100, 200, 1000, 5000]σ for an rms noise of 91 μJy. |
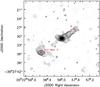 |
Fig. 7 Continuum emission towards PKS 0521-365 combining the Bands 3, 6 and 7 data (νeff = 221.02 GHz) after filtering at 4.5σ using a WT. The contours are at [3, 4, 5, 7, 9, 11, 15, 20, 30, 40, 50, 100, 200, 1000, 5000]σ for an rms noise of 90 μJy. The red crosses point to the 3 regions indicated in the text. |
In Figs. 4–6, the WT-filtered emission is shown toward PKS 0521-365 in Bands 3 (100 GHz), 6 (237 GHz), and b7 (336 GHz). Figure 7 shows the full WT-filtered combined dataset in Band 3+6+7. The radio continuum emission shares common features in the three bands: a strong core emission, a radio jet oriented in the N-W direction with a PA ~ 126°, a HS in the symmetric direction of the jet, and an elongated jet-like feature close to the nucleus and nearly perpendicular to the main jet with a PA ~ 66°. That last feature is more visible in Bands 6 and 7 than in Band 3 mainly because of the better spatial resolution. The main jet has a length of 6.8′′, i.e. 7.7 kpc in projection at the distance of PKS 0521-365. The jet-like feature has a very symmetric feature with a length of about 2.6′′ (2.9 kpc) in each direction. In Band 6 the counter jet is visible toward the S-E with a length of 3.9′′ (4.4 kpc). It is probably visible in Band 3 as well, but the poorer spatial resolution is not good enough.
Because of the dimming at high frequency, the counter jet is not detected so clearly in Band 7. We discuss below the comparison between the jet and counter jet. In Bands 6 and 7 the HS is spatially resolved with some extended emission because it was checked by removing a Gaussian component fitted on the HS and is indicated by the FWHM of the source #36 detected by SExtractor (see Table A.3). Inside the jet two main spots, dubbed A and B, are visible and have already been detected in different wavelengths (Tingay & Edwards 2002, and references therein). Together with the HS, we give their coordinates in Table 3 and their positions in Fig. 7. We discuss hereafter the diffuse emission outside of the nucleus, jet, and HS, which should trace the interaction of the jet with the local interstellar medium.
Flux of the counter jet in PKS 0521-365.
As indicated before, the WT-filtered decomposition allows analysis of the emission present on specific scales. In Fig. A.1 the emission in Band 3+6+7 on different scales is restored using the WT-filtered decomposition. The most emphasized features using that technique are the counter-jet emission and the extended emission of the HS. The discrete emission outside the central part is emphasized, too, in the different reconstructions, and its relevance was partially addressed before for the low brightness emission in Bands 6 and 7 using the wavelet Planes 2 to 4 (see Fig. 3), which select the spatial range 0.4′′–1.4′′ (see Leon et al. 2000), i.e. 450–1600 pc in the galaxy PKS 0521-365.
Because of the small viewing angle of the radio jet in blazar and in particular in PKS 0521-365 the relativistic beaming enhances the approaching blobs of plasma and dims the receding plasma. The counter jet is then more visible at low frequencies as it is observed here in PKS 0521-365 (see Table 4). Because of the low spatial resolution in Band 3 we searched for the counter-jet emission by using uniform weights during the imaging step, achieving detection in only three datasets. In Band 6, four datasets reveal the counter-jet emission, and because of its low brightness, the uncertainty on its flux is quite large. To compute the jet/counter-jet emission ratio, we use the Band 6 estimation with a better spatial resolution, i.e the Band 3+6+7 dataset, which has an effective frequency in Band 6 and a low rms noise. The jet and counter-jet flux was estimated by subtracting a Gaussian source fitting the nucleus from the image and selecting a polygonal area on the jet and the counter jet. The emission ratio between the jet and the counter jet was found to be ℜ = 10.2.
Assuming an equal intrinsic emission between the jet and the counter jet, the ratio J between both componet can be estimated as follows (e.g., in Ghisellini et al. 1993): 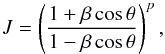 (4)where β is the bulk velocity expressed in units of the speed of light, θ is the viewing angle, and p can be expressed in the simplest cases as p = 2 + α (a moving isotropic source) or p = 3 + α (a continuous jet) with α the spectral index of the jet. In Fig. 8, the ratio J is shown for different bulk velocities taking an intermediate exponent p = 2.5, which is used for the analysis. To match the PKS 0521-365 ratio, it appears that the viewing angle must be in the range θ ⊂ [16°,38°] with a moderate bulk velocity β ⊂ [0.45,0.55]. These values give us a Lorentz factor Γ ⊂ [1.1,1.2] and a Doppler factor δ ⊂ [1.3,1.7].
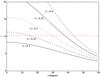 |
Fig. 8 Jet/counter-jet ratio J for an exponent p = 2.5 as a function of the viewing angle θ. The curves for different bulk velocities β are plotted. The horizontal line (dashed red line) indicates the flux ratio in PKS 0521-365. |
These results are similar to the values obtained by Pian et al. (1996), which have estimated the Lorentz factor of the plasma responsible for the radio jet to be Γ = 1.2 and a viewing angle of θ ~ 30°, giving a Doppler factor of δ = 1.6. It is also consistent with the space parameter exploration of Tingay et al. (2002; see Fig. 5 in their work).
The HS is located at 8.6′′ from the core position, or 9.9 kpc in projection. Assuming a viewing angle of 30° for the jet, we estimated the distance from the center to be 19.8 kpc. The HS exhibits an extended structure, especially in Bands 3 and 7 (see Figs. 4 and 5). After removing a fitted Gaussian on the HS, the extended structure is extended mainly in the northern direction (see Fig. A.2), with a projected position angle similar to the jet.
Flux of Regions A and B.
4. (Sub-)millimeter variability
The flux evolution of PKS 0521-365 in three bands of ALMA, 3, 6, and 7 were measured during nearly one year using calibration data of several unrelated scientific projects. The time sampling for each band was irregular and did not allow the very fast variation (intra-days) to be studied completely or a precise time variation to be measured of the individual blobs in the jet given the low signal-to-noise of the individual measurements, such as using a Fourier decomposition in the time domain. Nevertheless, it was possible to disclose important flux variations. In Fig. 9, the evolution of the total flux in the three bands is shown. No correction for the frequency was applied, but given the spectral index of the core in the different bands (see Table 7), the maximum correction would be in Band 7 on the order of 4%.
The variability index VI (Ciaramella et al. 2004) was introduced to parametrize the flux variation of a source: 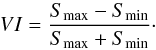 (5)For each band, the VI of PKS 0521-365 is then estimated on the sampling period of one year to be VIB3 = 0.33, VIB6 = 0.06, and VIB7 = 0.40, respectively (see Table 7). These values of the VI must be considered as lower limit during the year 2012 since the sampling is sparser than the variability in PKS 0521-365. The sparse and irregular sampling makes it difficult to draw clear conclusions on the variability between the bands. Nevertheless, it seems that the emission in Band 3, the lowest frequencies, is more variable than the other two bands.
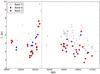 |
Fig. 9 Flux evolution of the core of PKS 0521-365. For the data from the Source Catalog, we removed the HS flux using the spectral fit. |
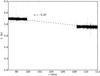 |
Fig. 10 Spectral index using the 4 simultaneous basebands observed with ALMA. Here is the example of the set J0522-364_99_2. The spectral index fit is indicated by the dashed line. |
Spectral index of the core of PKS 0521-365 measured on the basebands.
Mean values of core spectral index in PKS 0521-365 and the VI per band without correcting for the spectral dependence.
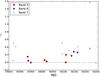 |
Fig. 11 Evolution of the spectral index α in the core of PKS 0521-365 vs. MJD. The data from the calibrator monitoring were added to the project data. In that case we remove the HS flux estimated from the SED fit. |
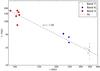 |
Fig. 12 SED of the HS in Bands 3, 6, and 7 and the fit of the spectral index α = −1.60. |
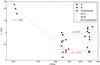 |
Fig. 13 SED of the measured continuum data in Regions A and B and the counter jet. A spectral index is fit in the three regions and indicated in the plot. |
5. Spectral index
In Table 6 the spectral index is given per dataset. The spectral index was computed measuring the core flux at the four basebands of a given dataset (see Fig. 10). The mean value of the spectral index was computed for each band (see Table 7) and shows a clear correlation with the frequency with a steepening toward the high frequency, −0.43 in Band 7 versus −0.08 in Band 3. The time evolution of the spectral index for each band (see Fig. 11) shows a very quick change for the spectral index in Band 7, while in less than five days it can change by more than 0.5 dex. That behavior was already shown at lower frequencies in other blazars (e.g., Venturi et al. 2001).
The dynamic range achieved for the imaging of the different dataset allows measuring the flux of the other components. Since Regions A and B are embedded in the jet emission, we take a fixed circular aperture of 1′′ around the peak emission to estimate the flux. The SED of these components is shown in Figs. 12 (HS) and 13 (counter jet, A and B). The very low value, −2.9, of the spectral index of the counter jet reflects not only the intrinsic flux distribution but also the relativistic beaming of the jet/counter jet as discussed before. The HS discloses a steep distribution with a spectral index of −1.6 similar to HSs at high frequency in other radio galaxies (Carilli et al. 1999; Okayasu et al. 1992).
Regions A and B in the radio jet show different behavior with a flat or even inverted spectrum. We note that because of the spatial resolution needed to distinguish Regions A and B, the spectral index was measured from Bands 6 and 7. Figure 13 makes the large dispersion of the measurements clear. The time variation cannot be discarded even if it is not expected. A most likely reason for these variations is the difficulty of extracting the flux from a region with a single dataset because of the low dynamic range in the radio jet and the ill-defined location. Despite these problems we can confidently affirm that Regions A and B have a relatively flat spectrum in Bands 6 and 7.
6. Discussion
6.1. Beamed radio jet
The detection of the jet and counter-jet emission allows us to use their ratio, R, as an alternative beaming indicator, assuming no isotropic component in the jet emission (Ghisellini et al. 1993). This beaming indicator is independent of other methods, such as the proper motion of blobs and the core to extended radio flux usually used with VLBI observations. Also, the resolution required to detect kinematic motions within the jet by ALMA is difficult to achieve frequently enough to monitor the movement of blobs within the jet. But when taking advantadge of the ALMA sensitivity, the detection of the counter-jet by the stacking approach followed here is a promising avenue at these frequencies. Our derived value for R is similar to those values derived from previous VLBI observations. Tingay et al. (1996) found lower limits for R in the range of our findings (5.0 and 9.3 at 4.8 GHz, and greater than 2.9 at 8.4 GHz). Further observations by Tingay & Edwards (2002) obtained R> 20 from the VLBI observations at 5 and 8.4 GHz increasing the previously obtained lower limit given the higher sensitivity of the new VLBI data. Although our result differs by a factor of 2, it is still within the expected range when compared to other highly beamed blazars (Ghisellini et al. 1993). As previously described, from R> 20 we derived bounded ranges for δ, Γ, β, and θ (see Sect. 3), whose mean values are in good agreement with previous studies, where ⟨ δ ⟩ = 1.5, ⟨ Γ ⟩ = 1.15, ⟨ θ ⟩ = 32.5°, and ⟨ β ⟩ = 0.5. In a highly beamed blazar, the ratio R gets enhanced by the beaming effect in the jet. Thus, a low value of R suggests that we are seeing the true bulk motions in the jet and not emission due to beaming effects. Tingay & Edwards (2002) observations constrain the parameter space to a well-defined region which centered the jet angle close to 30° and β ~ 0.5. These exploration of the β−θ plane also considered the calculations by Ghisellini et al. (1993) for the Doppler parameter (δ> 1) and Dondi & Ghisellini (1995) (δ> 1.3), which we can now constrain further with our ALMA data. It is no coincidence that our derived parameters lie just inside the box allowed by Tingay & Edwards (2002) in the β−θ plane and is also consistent with the values used for δ. Therefore, we found little support for highly beamed emission in PKS 0521-365; though not detected here, it is therefore unlikely that there are super-luminal motions along the jet.
6.2. Double jet, dust, or free-free emission
One of the striking results present in the millimeter continuum emisson toward PKS 0521-365 is an elongated structure nearly perpendicular to the well-defined radio jet (see Fig. 7). In the combined dataset with an effective frequency of 221 GHz, that structure has a size of 4.8′′, i.e. 5.5 kpc at the distance of PKS 0521-365and a position angle of 72°. The isophote fitting of the R-band image (Falomo 1994) indicates that this feature is aligned with the major axis of the host galaxy (PA ≈ 75°). The thermal (dust) emission or free-free emission from central star-forming region or synchrotron emission are then possible explanations for that feature.
Previous observations have shown a kpc-scale disk of molecular gas and dust in the center of radio galaxies (Martel et al. 1999; García-Burillo et al. 2007; Ocaña Flaquer et al. 2010). Also observed have been X-shaped radio sources with normal pairs of active lobes and lower surface brightness wings of emission (Leahy & Parma 1992; Dennett-Thorpe et al. 2002; Cheung 2007). The 15 GHz VLA map shown in Falomo et al. (2009) has a similar angular resolution (~0.5″) to the ALMA data and an rms noise of 200 μJy, which is sufficient to detect the perpendicular feature if it is a synchrotron emission. No hint of an elongated feature along the major axis is visible on the 15 GHz map where all the other features are clearly detected (HS, jet). Boisson et al. (1989) found a nebular line emission with a low surface brightness extending up to 21 kpc on the opposite side of the radio jet. It does not spatially match the secondary emission found in Bands 6 and 7 with ALMA.
The spectral index of the emission in the elongated feature between Bands 3 and 7 would allow synchrotron and thermal emission to be distinguished since in most cases, the SED slope are negative and positive, respectively. The spatial resolution of the current Band 3 data does not allow that feature to be resolved. The lack of evidence of that feature at 15 GHz favors the dust emission, but it will need to be confirmed by observations in Band 3 at a higher spatial resolution. In that case the presence of dust in the center of PKS 0521-365 should be associated with molecular gas that we should be able to detect in CO(1–0) emission or other tracers (Ocaña Flaquer et al. 2010).
7. Conclusions
The blazar PKS 0521-365 was studied using the ALMA public archive from the projects using that source as a calibrator over more than 11 months. The data in Bands 3, 6, and 7 were analyzed separately to follow the time variability and combined for each band in a superset at an effective frequency of 221 GHz. To enhance the imaging, we applied a wavelet filtering using the “A trous” algorithm to reach a final dynamic range of 47 000 in the superset of data. From that analysis we can draw several conclusions about the (sub-)millimeter emission of PKS 0521-365:
-
The detection of the submillimeter point sources in the field ofPKS 0521-365 are consistent withsub-millimeter galaxy count obtained with similar data usingALMA observations. They show the strong potential of thenumerous calibrator fields used in ALMA observations to build alarge sample of high-redshift sources over the whole sky spannedby the ALMA scientific projects. A careful analysis of thesources, beyond the scope of this study, would be needed todiscard spurious detections.
-
The (sub-)millimeter emission of the extended structures in PKS 0521-365 is detected in Bands 3, 6, and 7. The HS was clearly detected at 8′′ from the core. The strongly beamed radio jet was detected together with its internal regions (A and B). We detected the presence of a weak counter jet, symmetric to the radio jet. A roughly perpendicular disky structure is detected in Bands 3 and 6. That structure may be the relic of a previous jet, but a thermal origin cannot be discarded without more observations at higher spatial resolution and frequency.
-
The analysis of the time variability shows large variations during the nearly one year of measurements. The irregular sampling makes it difficult to perform a frequency analysis of the variation. The spectral index variation in the three bands shows large variations reaching 0.4–0.6 dex difference.
-
The spectral index analysis indicates a steepening of the SED in the core toward the highest frequencies (Band 7) whereas Regions A and B have a very flat spectrum. The counter jet displays a very steep SED because of the relativistic beaming in the blazar. By analyzing the data of the jet and counter jet, we were able to put a constraint on the Lorentz factor and on the viewing angle confirming previous studies at lower frequencies. According to that analysis, the HS would be at a distance of nearly 20 kpc from the core.
-
The HS shows an extended structure apart from its strong central emission. Despite the lower spatial resolution in Band 3, it seems to present more extended structures toward the low frequencies.
-
Our derived parameters for ⟨ δ ⟩ = 1.5, ⟨ Γ ⟩ = 1.15, ⟨ θ ⟩ = 32.5°, and ⟨ β ⟩ = 0.5 are within the range of the constraints imposed by VLBI observation in the β−θ plane, indicating that the emission from PKS 0521-365 is definitely not highly beamed and thus support minimal super-luminal motions along the jet.
Acknowledgments
We are grateful to the anonymous referee for the very useful comments. M. G. thanks ESO for his studentship. This paper makes use of the following ALMA data: ADS/JAO.ALMA#ID (Id are the project UID indicated in Table A.1). ALMA is a partnership of ESO (representing its member states), NSF (USA), and NINS (Japan), together with NRC (Canada) and NSC and ASIAA (Taiwan), in cooperation with the Republic of Chile. The Joint ALMA Observatory is operated by ESO, AUI/NRAO, and NAOJ.
References
- Antonucci, R. R. J., & Ulvestad, J. S. 1985, ApJ, 294, 158 [NASA ADS] [CrossRef] [Google Scholar]
- Bertin, E., & Arnouts, S. 1996, A&AS, 117, 393 [NASA ADS] [CrossRef] [EDP Sciences] [Google Scholar]
- Best, P. N., & Heckman, T. M. 2012, MNRAS, 421, 1569 [NASA ADS] [CrossRef] [Google Scholar]
- Bicknell, G. V. 1995, ApJS, 101, 29 [NASA ADS] [CrossRef] [Google Scholar]
- Bicknell, G. V., Sutherland, R. S., van Breugel, W. J. M., et al. 2000, ApJ, 540, 678 [NASA ADS] [CrossRef] [Google Scholar]
- Bijaoui, A. 1991, The Wavelet Transform, Data Analysis Workshop, 3 [Google Scholar]
- Birkinshaw, M., Worrall, D. M., & Hardcastle, M. J. 2002, MNRAS, 335, 142B [NASA ADS] [CrossRef] [Google Scholar]
- Blandford, R. D., & Rees, M. J. 1978, in Pittsburgh Conferences on BL Lac Objects, ed. A. N. Wolfe (Pittsburgh: University of Pittsburgh Press), 328 [Google Scholar]
- Boisson, C., Cayatte, V., & Sol, H. 1989, A&A, 211, 275 [NASA ADS] [Google Scholar]
- Capetti, A., Raiteri, C. M., & Buttiglione, S. 2010, A&A, 516, A59 [NASA ADS] [CrossRef] [EDP Sciences] [Google Scholar]
- Carilli, C. L., Kurk, J. D., van der Werf, P. P., Perley, R. A., & Miley, G. K. 1999, AJ, 118, 2581 [NASA ADS] [CrossRef] [Google Scholar]
- Carvalho, J. C. 1998, A&A, 329, 845 [NASA ADS] [Google Scholar]
- Chen, X., Fossati, G., Böttcher, M., & Liang, E. 2012, MNRAS, 424, 789 [NASA ADS] [CrossRef] [Google Scholar]
- Cheung, C. C. 2007, AJ, 133, 2097 [NASA ADS] [CrossRef] [Google Scholar]
- Ciaramella, A., Bongardo, C., Aller, H. D., et al. 2004, A&A, 419, 485 [NASA ADS] [CrossRef] [EDP Sciences] [Google Scholar]
- Danziger, I. J., Fosbury, R. A. E., Goss, W. M., & Ekers, R. D. 1979, MNRAS, 188, 415 [NASA ADS] [Google Scholar]
- Danziger, I. J., Bergeron, J., Fosbury, R. A. E., et al. 1983, MNRAS, 203, 565 [NASA ADS] [CrossRef] [Google Scholar]
- Dennett-Thorpe, J., Scheuer, P. A. G., Laing, R. A., et al. 2002, MNRAS, 330, 609 [NASA ADS] [CrossRef] [Google Scholar]
- Dey, A., van Breugel, W., Vacca, W. D., & Antonucci, R. 1997, ApJ, 490, 698 [NASA ADS] [CrossRef] [Google Scholar]
- Dondi, L., & Ghisellini, G. 1995, MNRAS, 273, 583 [NASA ADS] [Google Scholar]
- Fabian, A. C. 2012, ARA&A, 50, 455 [NASA ADS] [CrossRef] [Google Scholar]
- Falcke, H., Wilson, A. S., & Simpson, C. 1998, ApJ, 502, 199 [Google Scholar]
- Falomo, R. 1994, The Messenger, 77, 49 [NASA ADS] [Google Scholar]
- Falomo, R., Pian, E., Treves, A., et al. 2009, A&A, 501, 907 [NASA ADS] [CrossRef] [EDP Sciences] [Google Scholar]
- Fanaroff, B. L., & Riley, J. M. 1974, MNRAS, 167, 31 [NASA ADS] [CrossRef] [Google Scholar]
- Fossati, G., Maraschi, L., Celotti, A., Comastri, A., & Ghisellini, G. 1998, MNRAS, 299, 433 [NASA ADS] [CrossRef] [Google Scholar]
- García-Burillo, S., Combes, F., Neri, R., et al. 2007, A&A, 468, 71 [Google Scholar]
- Ghisellini, G., Haardt, F., & Fabian, A. C. 1993, MNRAS, 263, 9 [Google Scholar]
- Grossmann, A., & Morlet, J. 1985, in Mathematics+Physics, Lecture on recent results, ed. L. Streit (Singapore: World Scientific) [Google Scholar]
- Hatsukade, B., Ohta, K., Seko, Ak., Yabe, K., & Akiyama, M. 2013, ApJ, 769, 27 [Google Scholar]
- Keel, W. C. 1986, ApJ, 302, 296 [NASA ADS] [CrossRef] [Google Scholar]
- Khalatyan, A., Cattaneo, A., Schramm, M., et al. 2008, MNRAS, 387, 13 [NASA ADS] [CrossRef] [Google Scholar]
- Leahy, J. P., & Parma, P. 1992, in Extragalactic Radio Sources: From Beams to Jets, eds. J. Roland, H. Sol, & G. Pelletier (Cambridge: Cambridge Univ. Press), 307 [Google Scholar]
- Leon, S., Meylan, G., & Combes, F. 2000, A&A, 359, 907 [NASA ADS] [Google Scholar]
- Lister, M. L., & Marscher, A. P. 1997, ApJ, 476, 572 [NASA ADS] [CrossRef] [Google Scholar]
- Macchetto, F., Albrecht, R., Barbieri, C., et al. 1991, ApJ, 369, 55 [Google Scholar]
- Maraschi, L., & Tavecchio, F. 2003, ApJ, 593, 667 [NASA ADS] [CrossRef] [Google Scholar]
- Martel, A. R., Baum, S. A., Sparks, W. B., et al. 1999, ApJS, 122, 81 [NASA ADS] [CrossRef] [Google Scholar]
- McCarthy, P. J., van Breugel, W., Spinrad, H., & Djorgovski, S. 1987, ApJ, 321, 29 [Google Scholar]
- Ocaña Flaquer, B., Leon, S., Combes, F., & Lim, J. 2010, A&A, 518, A9 [NASA ADS] [CrossRef] [EDP Sciences] [Google Scholar]
- Okayasu, R., Ishiguro, M., & Tabara, H. 1992, PASJ, 44, 335 [NASA ADS] [Google Scholar]
- Pian, E., Falomo, R., Ghisellini, G., et al. 1996, ApJ, 459, 169 [NASA ADS] [CrossRef] [Google Scholar]
- Rau, U., & Cornwell, T. J. 2011, A&A, 532, A71 [NASA ADS] [CrossRef] [EDP Sciences] [Google Scholar]
- Rashed, Y. E., Zuther, J., Eckart, A., et al. 2013, A&A, 558, A5 [NASA ADS] [CrossRef] [EDP Sciences] [Google Scholar]
- Scarpa, R., Falomo, R., & Pian, E. 1995, A&A, 303, 730 [NASA ADS] [Google Scholar]
- Scarpa, R., Urry, C. M., Falomo, R., & Treves, A. 1999, ApJ, 526, 643 [NASA ADS] [CrossRef] [Google Scholar]
- Sparks, W. B., Biretta, J. A., & Macchetto, F. 1994, ApJS, 90, 909 [NASA ADS] [CrossRef] [Google Scholar]
- Stawarz, Ł., Aharonian, F., Kataoka, J., et al. 2006, MNRAS, 370, 981 [NASA ADS] [CrossRef] [Google Scholar]
- Sturm, E., González-Alfonso, E., Veilleux, S., et al. 2011, ApJ, 733, 16 [Google Scholar]
- Ulrich, M. H. 1981, A&A, 103, 1 [Google Scholar]
- Urry, C. M., & Padovani, P. 1995, PASP, 107, 803 [NASA ADS] [CrossRef] [Google Scholar]
- Venturi, T., Dallacasa, D., Orfei, A., et al. 2001, A&A, 379, 755 [NASA ADS] [CrossRef] [EDP Sciences] [Google Scholar]
- Tavecchio, F., Maraschi, L., & Ghisellini, G. 1998, ApJ, 509, 608 [NASA ADS] [CrossRef] [Google Scholar]
- Tingay, S. J., & Edwards, P. G. 2002, AJ, 124, 652 [NASA ADS] [CrossRef] [Google Scholar]
Appendix A: Additional tables and figures
Journal of the observations.
Dataset properties (natural weighting).
Properties of the point sources detected in the Band 3+6+7 (νeff = 221.02 GHz) at a 4σ level in a box of 1′ × 1′.
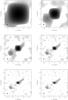 |
Fig. A.1 Image restoration of the combined Band 3+6+7 emission using different ranges of the wavelet-filtered planes: Planes 6-to-7 (low spatial frequency) in the top left figure to Planes 1 to 7 (high spatial frequency) in the bottom right figure. The full reconstruction is achieved with the Planes 0 to 7. |
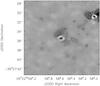 |
Fig. A.2 Emission of the full data set in Bands 3, 6, and 7. The contours are at [3, 4, 5, 6, 7, 8, 9, 10]σ for an rms noise of 90 μJy. A Gaussian was fitted and removed from the core emission. The counter jet is visible in the southeast between the HS and the core. |
All Tables
Properties of different wavelet reconstruction of the Band 3+6+7 combined and WT filtered at 4.5σ.
Mean values of core spectral index in PKS 0521-365 and the VI per band without correcting for the spectral dependence.
Properties of the point sources detected in the Band 3+6+7 (νeff = 221.02 GHz) at a 4σ level in a box of 1′ × 1′.
All Figures
|
Fig. 1 Point sources detected in the combined field of Bands 3, 6, and 7 (νeff = 221.02 GHz) after WT filtering at 4.5σ. The symbols are proportional to the flux. The field is centered on PKS 0521-365. The colored circles represent the primary beamsize of each band. |
| In the text | |
|
Fig. 2 Cumulative number count at 221 GHz in a field of 1′ × 1′ between fluxes of 0.1 mJy and 3 mJy. The effective rms noise in the WT-filtered image is 100 μJy. |
| In the text | |
|
Fig. 3 Contour levels at [4, 4.5, 5, 5.5, 6]σ of the B6+B7 WT for the scales 2 to 4. The image is the Band 7 emission. |
| In the text | |
|
Fig. 4 Continuum emission toward PKS 0521-365 in Band 3 (νeff = 100.43 GHz) after filtering at 4.5σ using a WT. The contours are at [3, 5, 7, 9, 11, 15, 20, 30, 40, 50, 100, 200, 1000, 5000]σ for an rms noise of 306 μJy. |
| In the text | |
|
Fig. 5 Continuum emission toward PKS 0521-365 in Band 6 (νeff = 237.06 GHz) after filtering at 4.5σ using a WT. The contours are at [3, 4, 5, 7, 9, 11, 15, 20, 30, 40, 50, 100, 200, 1000, 5000]σ for an rms noise of 147 μJy. |
| In the text | |
|
Fig. 6 Continuum emission toward PKS 0521-365 in Band 7 (νeff = 336.44 GHz) after filtering at 4.5σ using a WT. The contours are at [3, 4, 5, 7, 9, 11, 15, 20, 30, 40, 50, 100, 200, 1000, 5000]σ for an rms noise of 91 μJy. |
| In the text | |
|
Fig. 7 Continuum emission towards PKS 0521-365 combining the Bands 3, 6 and 7 data (νeff = 221.02 GHz) after filtering at 4.5σ using a WT. The contours are at [3, 4, 5, 7, 9, 11, 15, 20, 30, 40, 50, 100, 200, 1000, 5000]σ for an rms noise of 90 μJy. The red crosses point to the 3 regions indicated in the text. |
| In the text | |
|
Fig. 8 Jet/counter-jet ratio J for an exponent p = 2.5 as a function of the viewing angle θ. The curves for different bulk velocities β are plotted. The horizontal line (dashed red line) indicates the flux ratio in PKS 0521-365. |
| In the text | |
|
Fig. 9 Flux evolution of the core of PKS 0521-365. For the data from the Source Catalog, we removed the HS flux using the spectral fit. |
| In the text | |
|
Fig. 10 Spectral index using the 4 simultaneous basebands observed with ALMA. Here is the example of the set J0522-364_99_2. The spectral index fit is indicated by the dashed line. |
| In the text | |
|
Fig. 11 Evolution of the spectral index α in the core of PKS 0521-365 vs. MJD. The data from the calibrator monitoring were added to the project data. In that case we remove the HS flux estimated from the SED fit. |
| In the text | |
|
Fig. 12 SED of the HS in Bands 3, 6, and 7 and the fit of the spectral index α = −1.60. |
| In the text | |
|
Fig. 13 SED of the measured continuum data in Regions A and B and the counter jet. A spectral index is fit in the three regions and indicated in the plot. |
| In the text | |
|
Fig. A.1 Image restoration of the combined Band 3+6+7 emission using different ranges of the wavelet-filtered planes: Planes 6-to-7 (low spatial frequency) in the top left figure to Planes 1 to 7 (high spatial frequency) in the bottom right figure. The full reconstruction is achieved with the Planes 0 to 7. |
| In the text | |
|
Fig. A.2 Emission of the full data set in Bands 3, 6, and 7. The contours are at [3, 4, 5, 6, 7, 8, 9, 10]σ for an rms noise of 90 μJy. A Gaussian was fitted and removed from the core emission. The counter jet is visible in the southeast between the HS and the core. |
| In the text | |
Current usage metrics show cumulative count of Article Views (full-text article views including HTML views, PDF and ePub downloads, according to the available data) and Abstracts Views on Vision4Press platform.
Data correspond to usage on the plateform after 2015. The current usage metrics is available 48-96 hours after online publication and is updated daily on week days.
Initial download of the metrics may take a while.