Fig. A.1
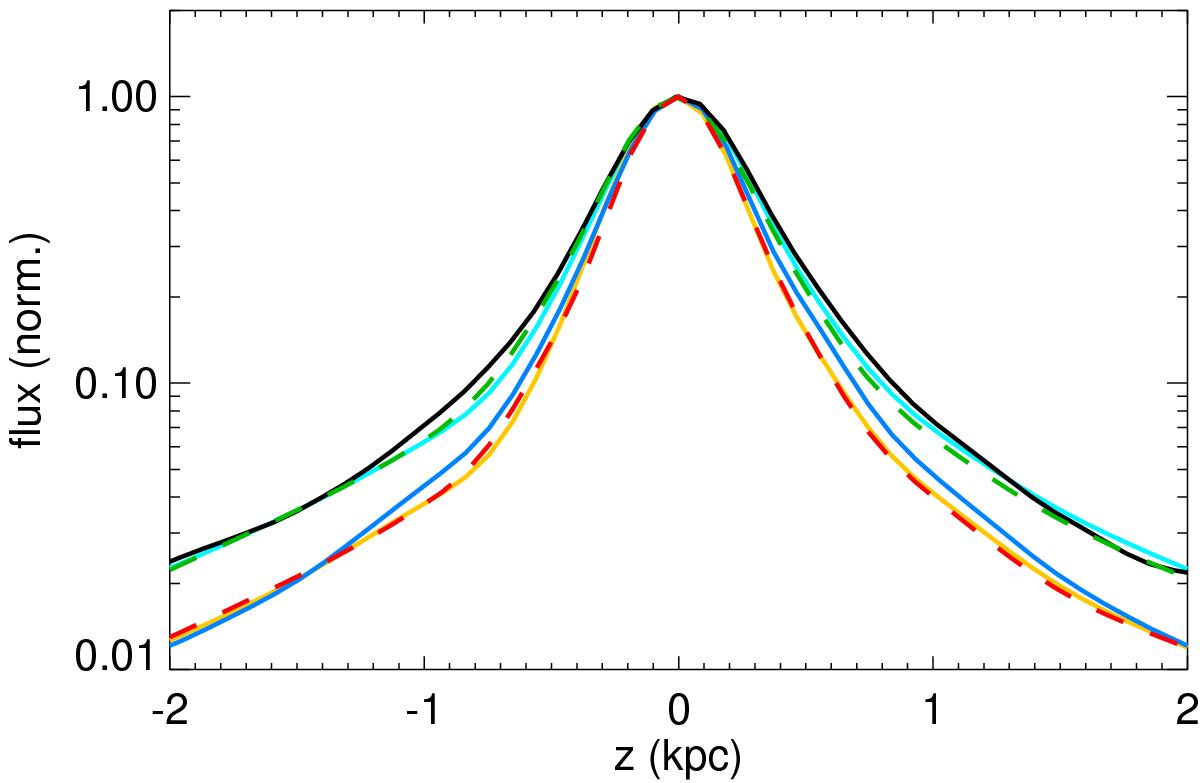
Normalised vertical profiles for PACS 100 μm. Blue and black solid lines refer to the observed profiles at galactic scale and for Region X, respectively. Cyan and orange solid lines represent the vertical profiles obtained from our simple geometrical model without (case α) and with (case β) a super thin disc included, respectively, while green and red dashed lines indicate the results of the fit in the two cases.
Current usage metrics show cumulative count of Article Views (full-text article views including HTML views, PDF and ePub downloads, according to the available data) and Abstracts Views on Vision4Press platform.
Data correspond to usage on the plateform after 2015. The current usage metrics is available 48-96 hours after online publication and is updated daily on week days.
Initial download of the metrics may take a while.