Fig. 7
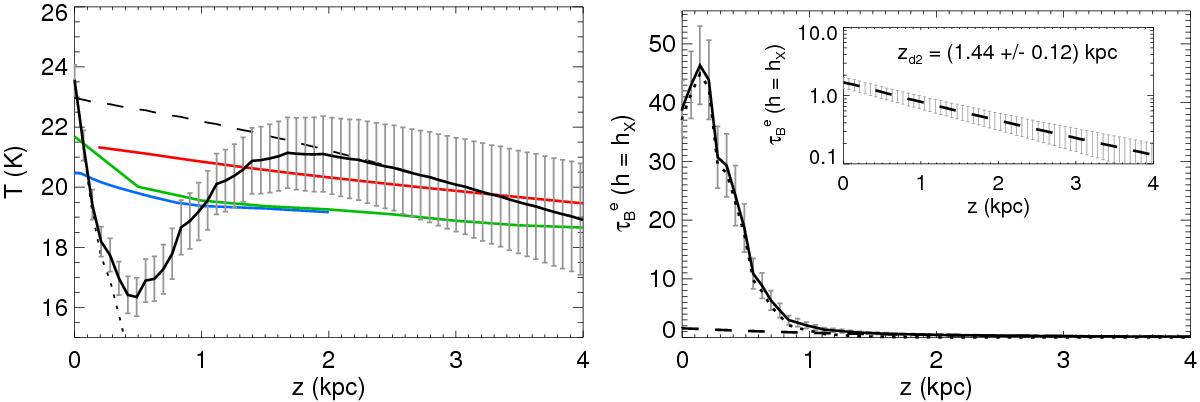
Temperature (left panel) and
![]() (right panel)
profiles as obtained from MBB fitting (black lines). Contributions from the thin
(dotted lines) and thick (dashed lines) discs are shown. Temperature profiles
obtained using the Jones et al. (2013) and
the radiative transfer models RT1, RT2, and RT3, are indicated with blue, red, and
green lines, respectively. In the inset we show
(right panel)
profiles as obtained from MBB fitting (black lines). Contributions from the thin
(dotted lines) and thick (dashed lines) discs are shown. Temperature profiles
obtained using the Jones et al. (2013) and
the radiative transfer models RT1, RT2, and RT3, are indicated with blue, red, and
green lines, respectively. In the inset we show
![]() for the thick component and indicate
its scale height.
for the thick component and indicate
its scale height.
Current usage metrics show cumulative count of Article Views (full-text article views including HTML views, PDF and ePub downloads, according to the available data) and Abstracts Views on Vision4Press platform.
Data correspond to usage on the plateform after 2015. The current usage metrics is available 48-96 hours after online publication and is updated daily on week days.
Initial download of the metrics may take a while.