Free Access
Fig. 4
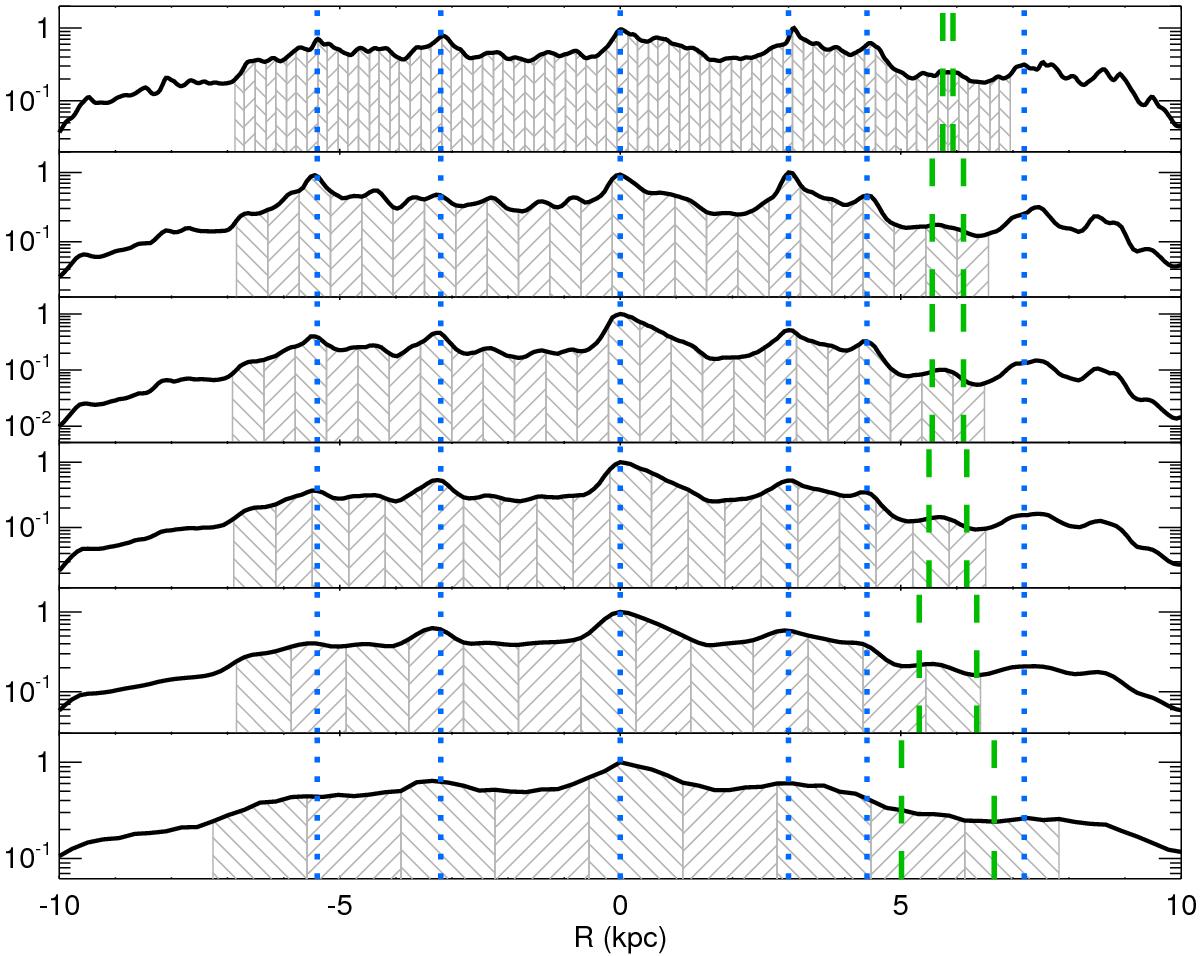
Radial profiles for IRAC 8 μm, MIPS 24 μm, PACS 70, 100 and 160 μm and SPIRE 250 μm (from top to bottom). The position of the main peaks in emission (blue dotted lines) and the Region X (green dashed lines) are indicated.
Current usage metrics show cumulative count of Article Views (full-text article views including HTML views, PDF and ePub downloads, according to the available data) and Abstracts Views on Vision4Press platform.
Data correspond to usage on the plateform after 2015. The current usage metrics is available 48-96 hours after online publication and is updated daily on week days.
Initial download of the metrics may take a while.