Fig. 3
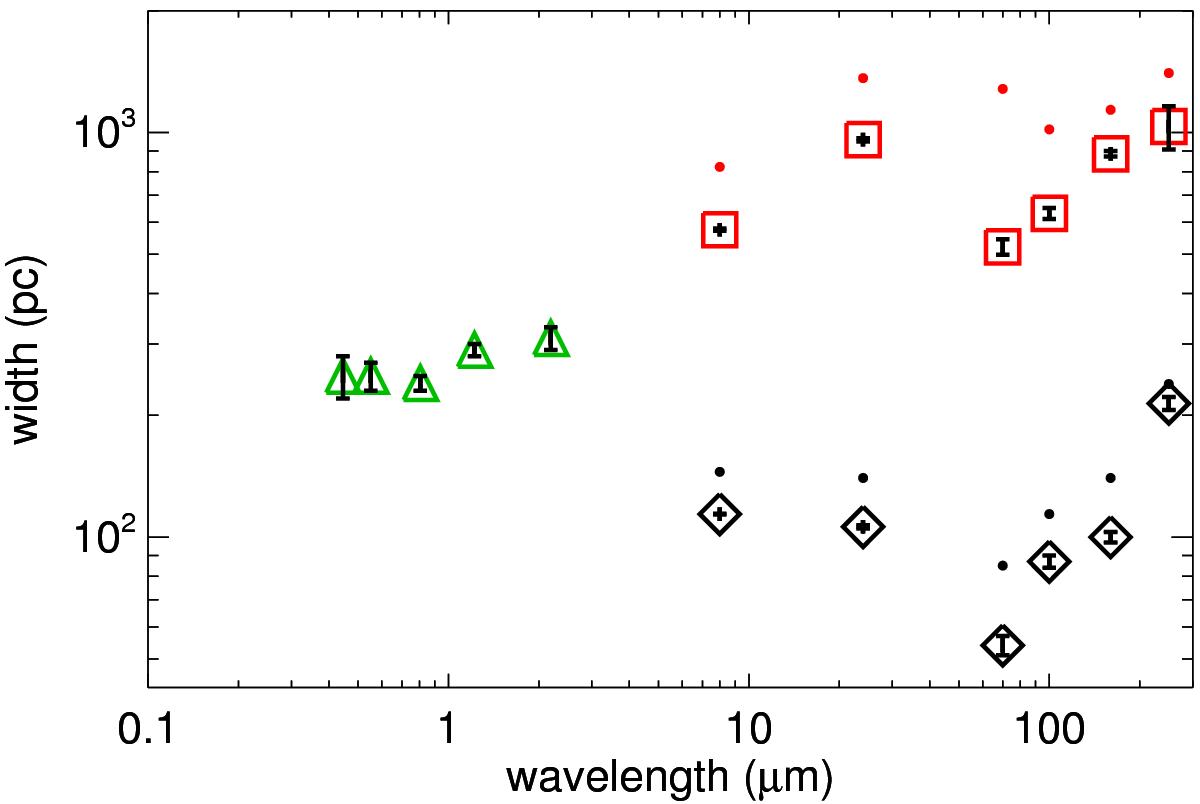
Scale heights of the thin (black diamonds) and thick (red squares) dust components. Green triangles represent the dust scale heights as estimated by Xilouris et al. (1999). Black and red dots represent the scale heights as measured in Region X (see Sect. 4). Our best set of PSFs is used for convolution.
Current usage metrics show cumulative count of Article Views (full-text article views including HTML views, PDF and ePub downloads, according to the available data) and Abstracts Views on Vision4Press platform.
Data correspond to usage on the plateform after 2015. The current usage metrics is available 48-96 hours after online publication and is updated daily on week days.
Initial download of the metrics may take a while.