Free Access
Fig. B.4
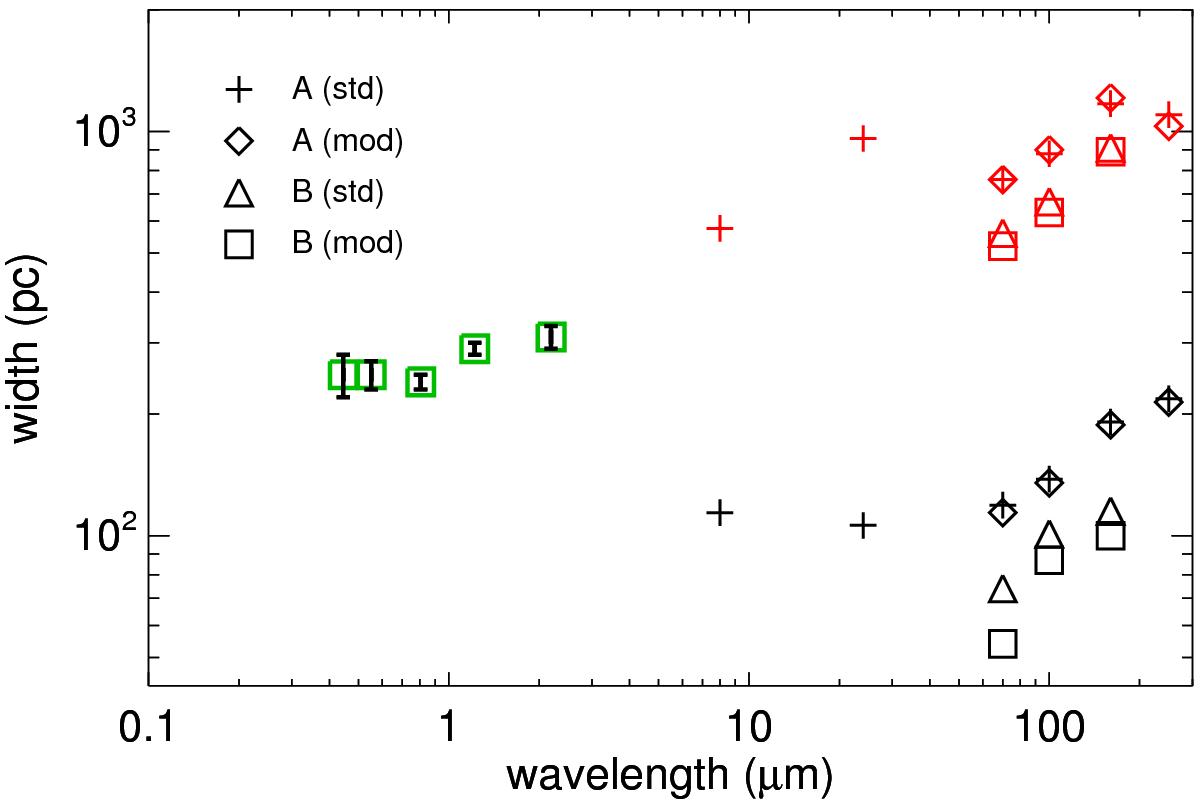
Scale heights of the thin (black symbols) and thick (red symbols) dust components, assuming different PSFs. Green squares represent the dust scaleheights as estimated by Xilouris et al. (1999).
Current usage metrics show cumulative count of Article Views (full-text article views including HTML views, PDF and ePub downloads, according to the available data) and Abstracts Views on Vision4Press platform.
Data correspond to usage on the plateform after 2015. The current usage metrics is available 48-96 hours after online publication and is updated daily on week days.
Initial download of the metrics may take a while.