Free Access
Fig. B.2
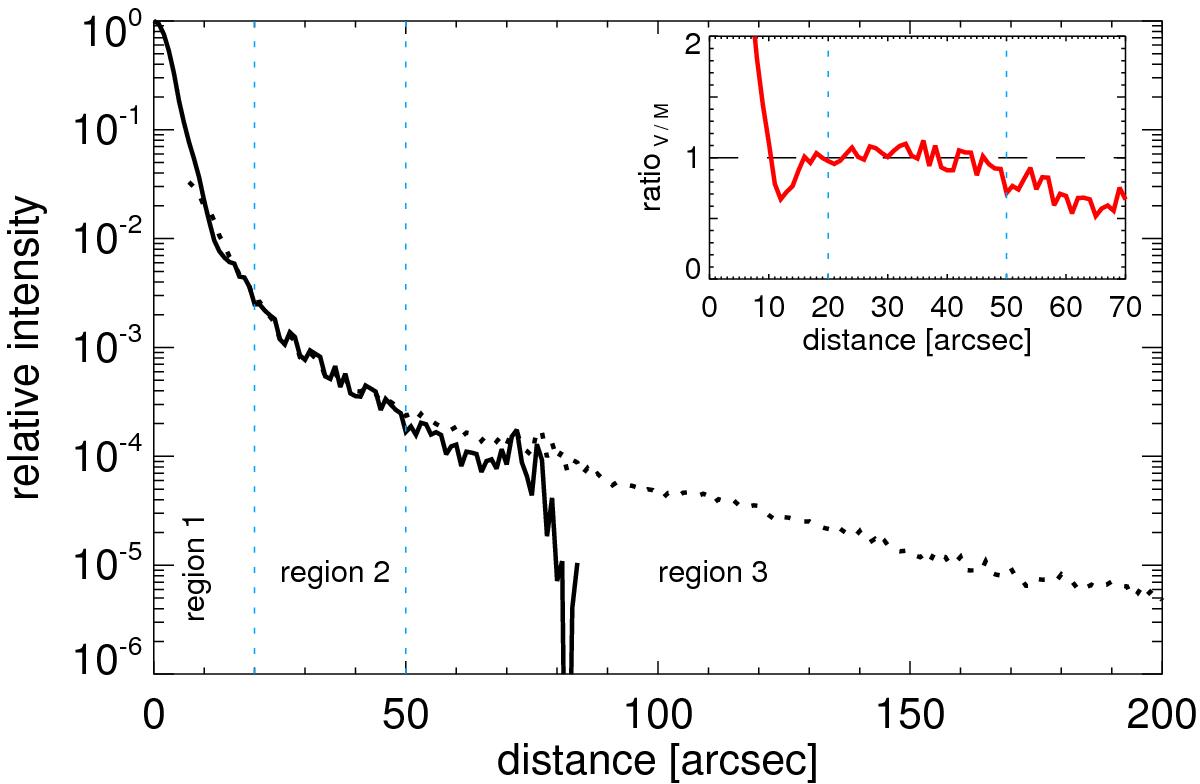
Radial profiles of Vesta (black solid line) and Mars (black dotted line) observations at 70 μm. In the inset, the ratio between the Vesta and Mars profiles is shown (red solid line). Regions are indicated (see text for details).
Current usage metrics show cumulative count of Article Views (full-text article views including HTML views, PDF and ePub downloads, according to the available data) and Abstracts Views on Vision4Press platform.
Data correspond to usage on the plateform after 2015. The current usage metrics is available 48-96 hours after online publication and is updated daily on week days.
Initial download of the metrics may take a while.