Fig. 5
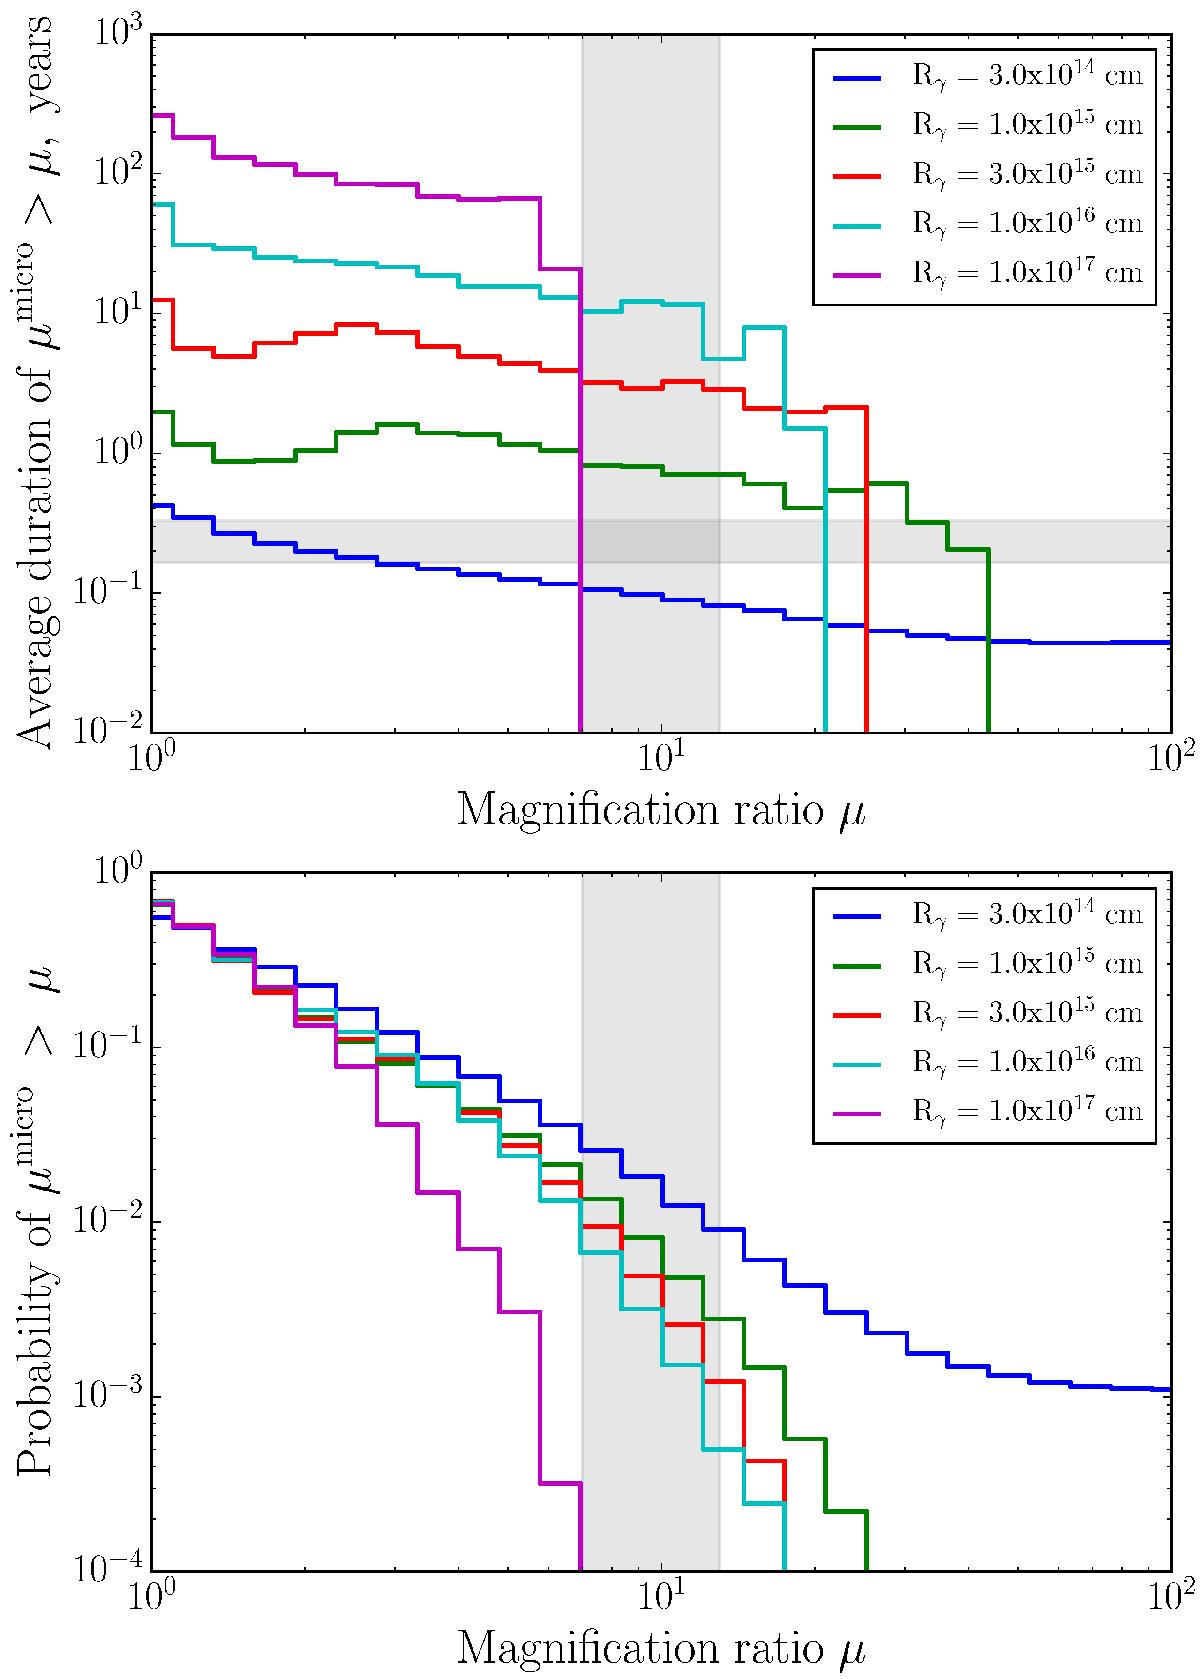
Top: distribution of the average durations of the microlensing magnification episodes obtained from the simulations for Σ = 0.5 and v = 300 km s-1. Horizontal shaded region depicts the range 60−120 days of the apparent variability time scales of the magnification factor ratio in B0218+357, and the vertical one depicts the microlensing magnification ratio range, suggested by the observations. Bottom: cumulative probability of observing microlensing magnification factor ratio >μ for different source sizes, estimated from the simulations. The vertical shaded region is the same as in the upper panel.
Current usage metrics show cumulative count of Article Views (full-text article views including HTML views, PDF and ePub downloads, according to the available data) and Abstracts Views on Vision4Press platform.
Data correspond to usage on the plateform after 2015. The current usage metrics is available 48-96 hours after online publication and is updated daily on week days.
Initial download of the metrics may take a while.