Free Access
Fig. 4
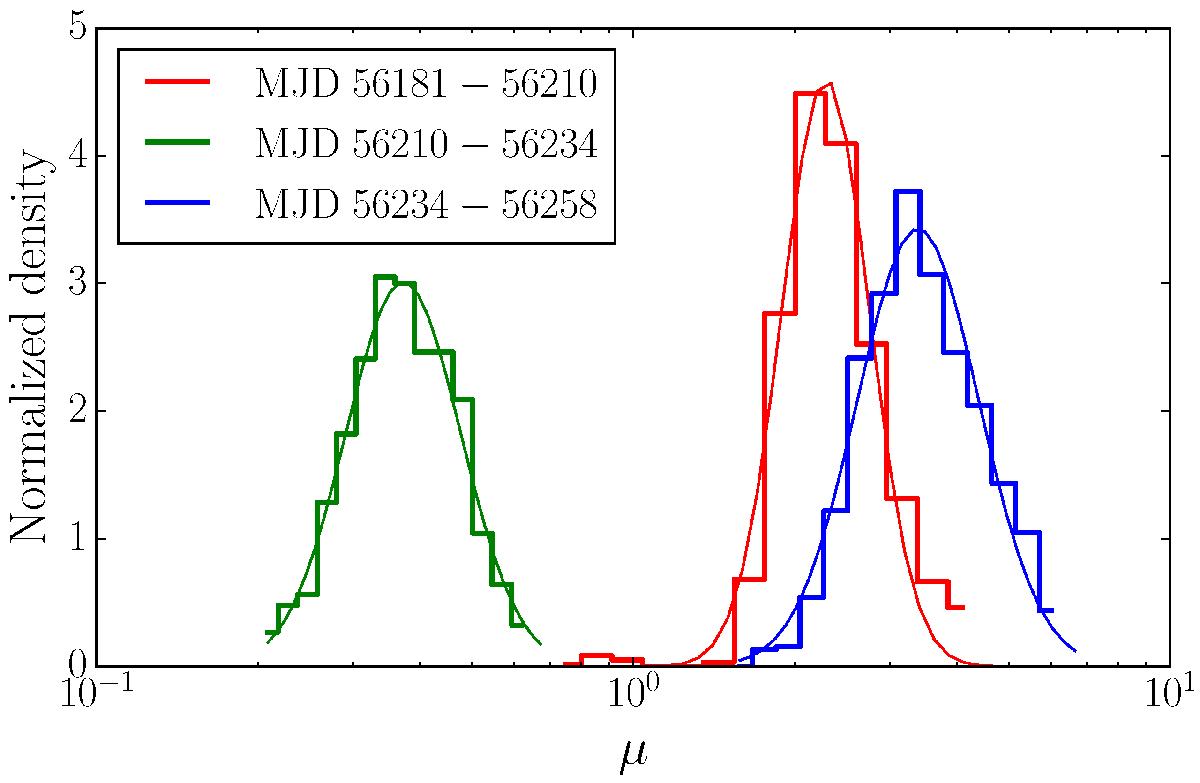
Distributions of the best-fit values of the magnification factor ratio μ for the three brightest flaring episodes in 2012 (3 central panels in Fig. 3), derived through the Monte Carlo simulations.
Current usage metrics show cumulative count of Article Views (full-text article views including HTML views, PDF and ePub downloads, according to the available data) and Abstracts Views on Vision4Press platform.
Data correspond to usage on the plateform after 2015. The current usage metrics is available 48-96 hours after online publication and is updated daily on week days.
Initial download of the metrics may take a while.