Fig. 3
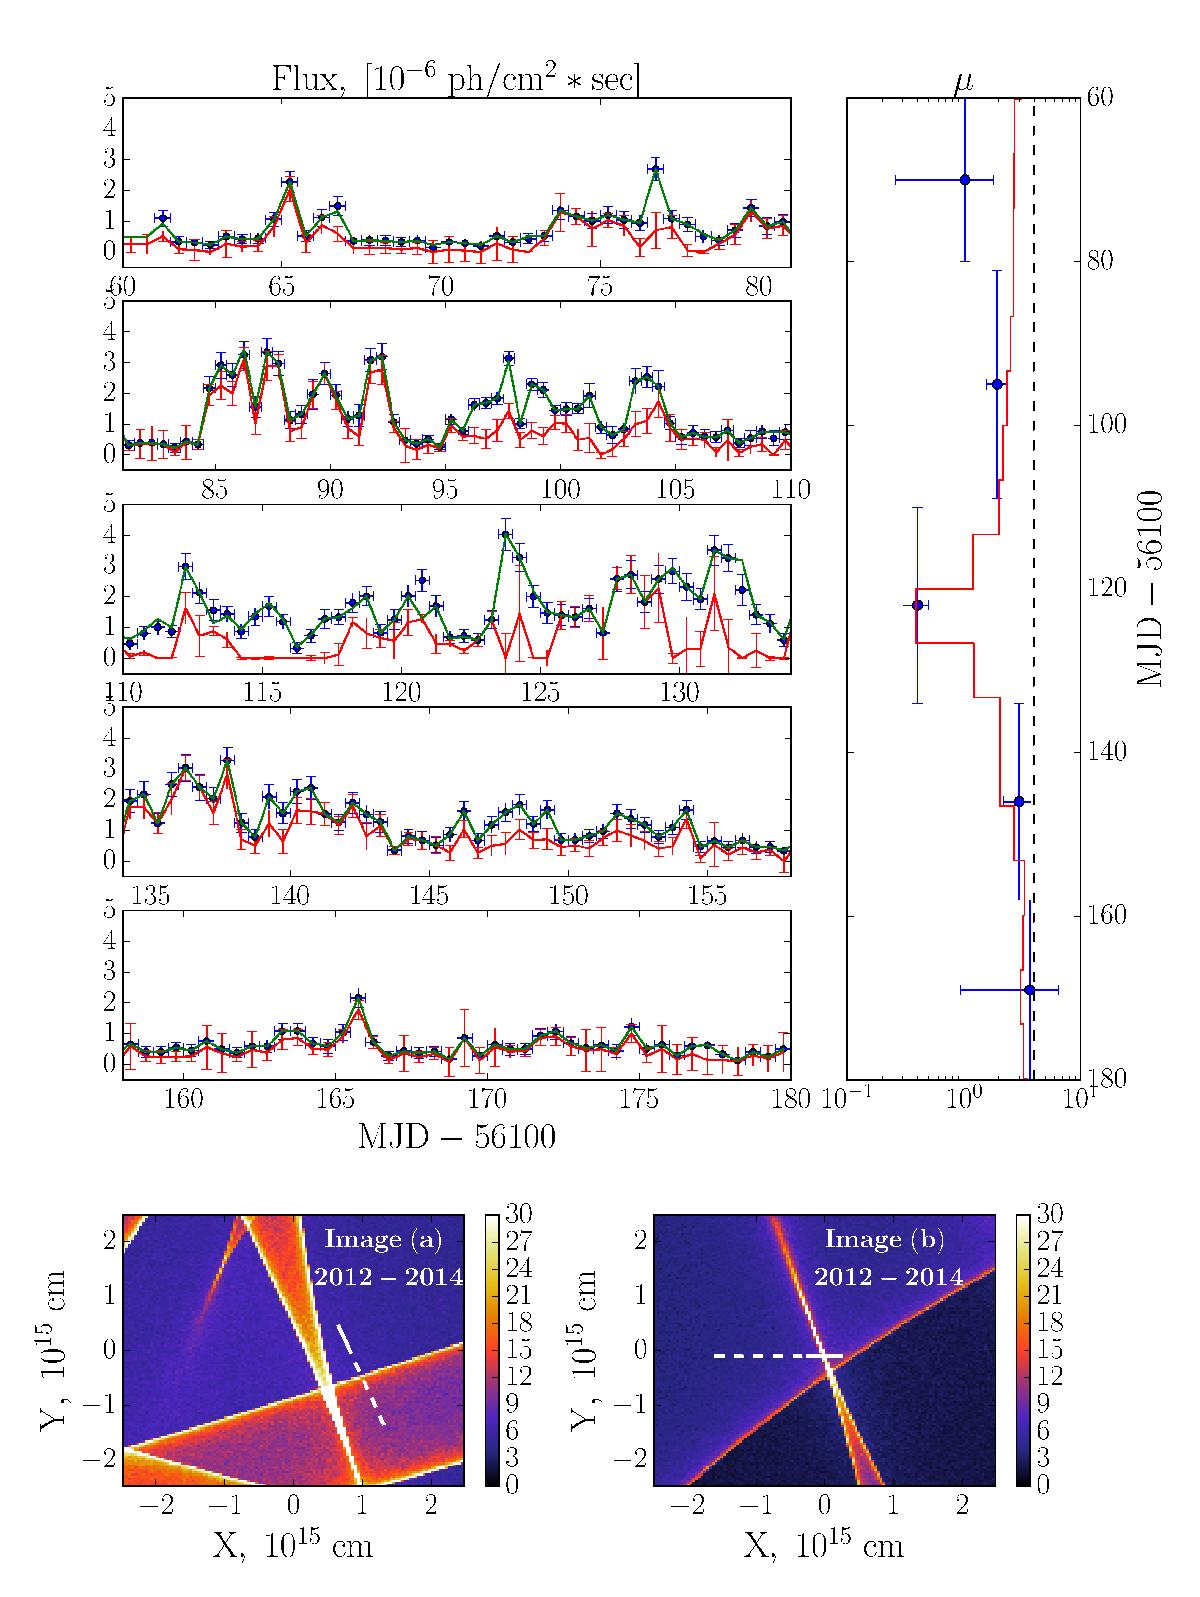
Top left: decomposition of the different flaring episodes of the B0218+357 major flare in 2012. The original Fermi/LAT light curve is shown in blue, the reconstructed light curve of the leading image μγF(t) is shown in red, and the total reconstructed light curve Ftot(t) is shown with a green line. Top right: derived magnification factor ratio for each of the flaring episodes. Black dashed line indicates the approximate value of the magnification factor ratio in radio band μrad ≈ 4. The red line depicts the variation of the magnification factor ratio during one of the caustic-crossing events in our simulations, which can be tentatively associated with the observed behaviour. It was computed for Rsource ≈ 1014 cm. This event is shown in lower panels. Bottom: microlensing caustic-magnification patterns that can be associated with the detected variability of magnification factor during the 2012 and 2014 flares. The colour bars represent the microlensing magnification (or demagnification if the value is <1). Distances are given in the source plane. The patterns are shown separately for the leading (left) and delayed images (right). Solid white lines indicate the putative trajectories of the images during the 2012 flare, dashed lines depict the displacement of the images over the 2012−2014 period.
Current usage metrics show cumulative count of Article Views (full-text article views including HTML views, PDF and ePub downloads, according to the available data) and Abstracts Views on Vision4Press platform.
Data correspond to usage on the plateform after 2015. The current usage metrics is available 48-96 hours after online publication and is updated daily on week days.
Initial download of the metrics may take a while.