Fig. 2
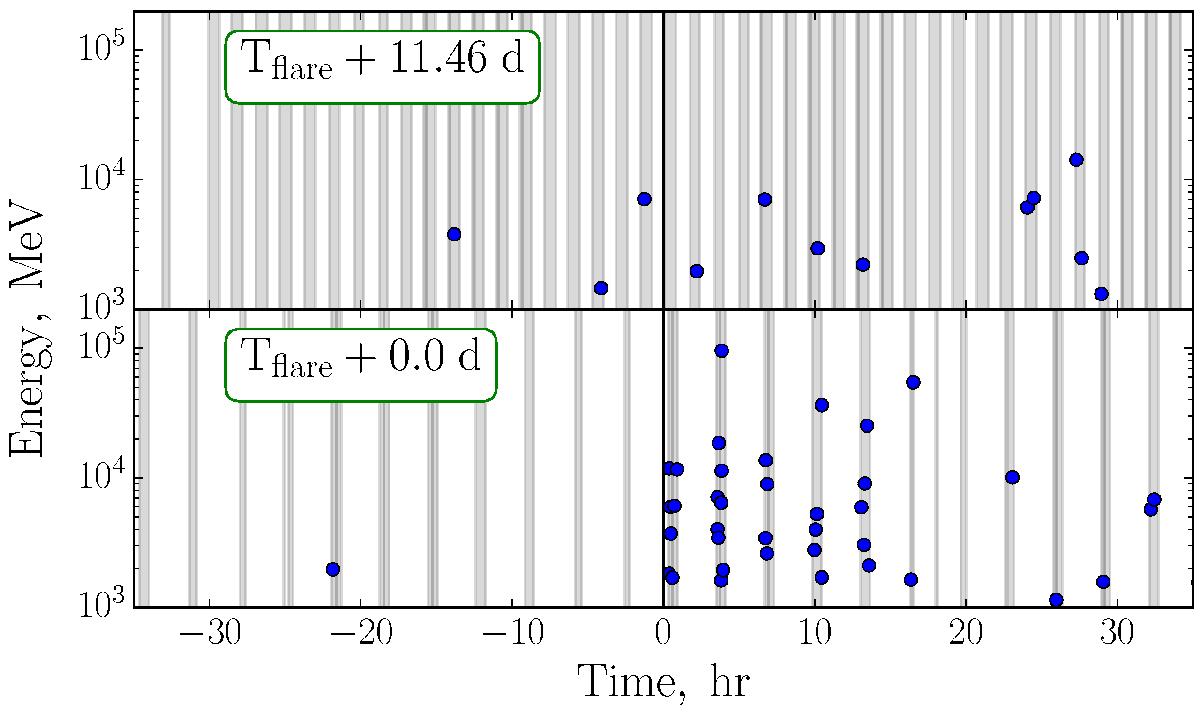
Arrival times and energies of photons above 1 GeV during the 2014 flare (bottom panel) and during the period after the gravitational time delay (top panel). Grey vertical bands mark the intervals of time, when Fermi/LAT pointing was not farther away than 60° from the source position. Photons were selected within the circle of 0.5° in radius.
Current usage metrics show cumulative count of Article Views (full-text article views including HTML views, PDF and ePub downloads, according to the available data) and Abstracts Views on Vision4Press platform.
Data correspond to usage on the plateform after 2015. The current usage metrics is available 48-96 hours after online publication and is updated daily on week days.
Initial download of the metrics may take a while.