Free Access
Fig. 1
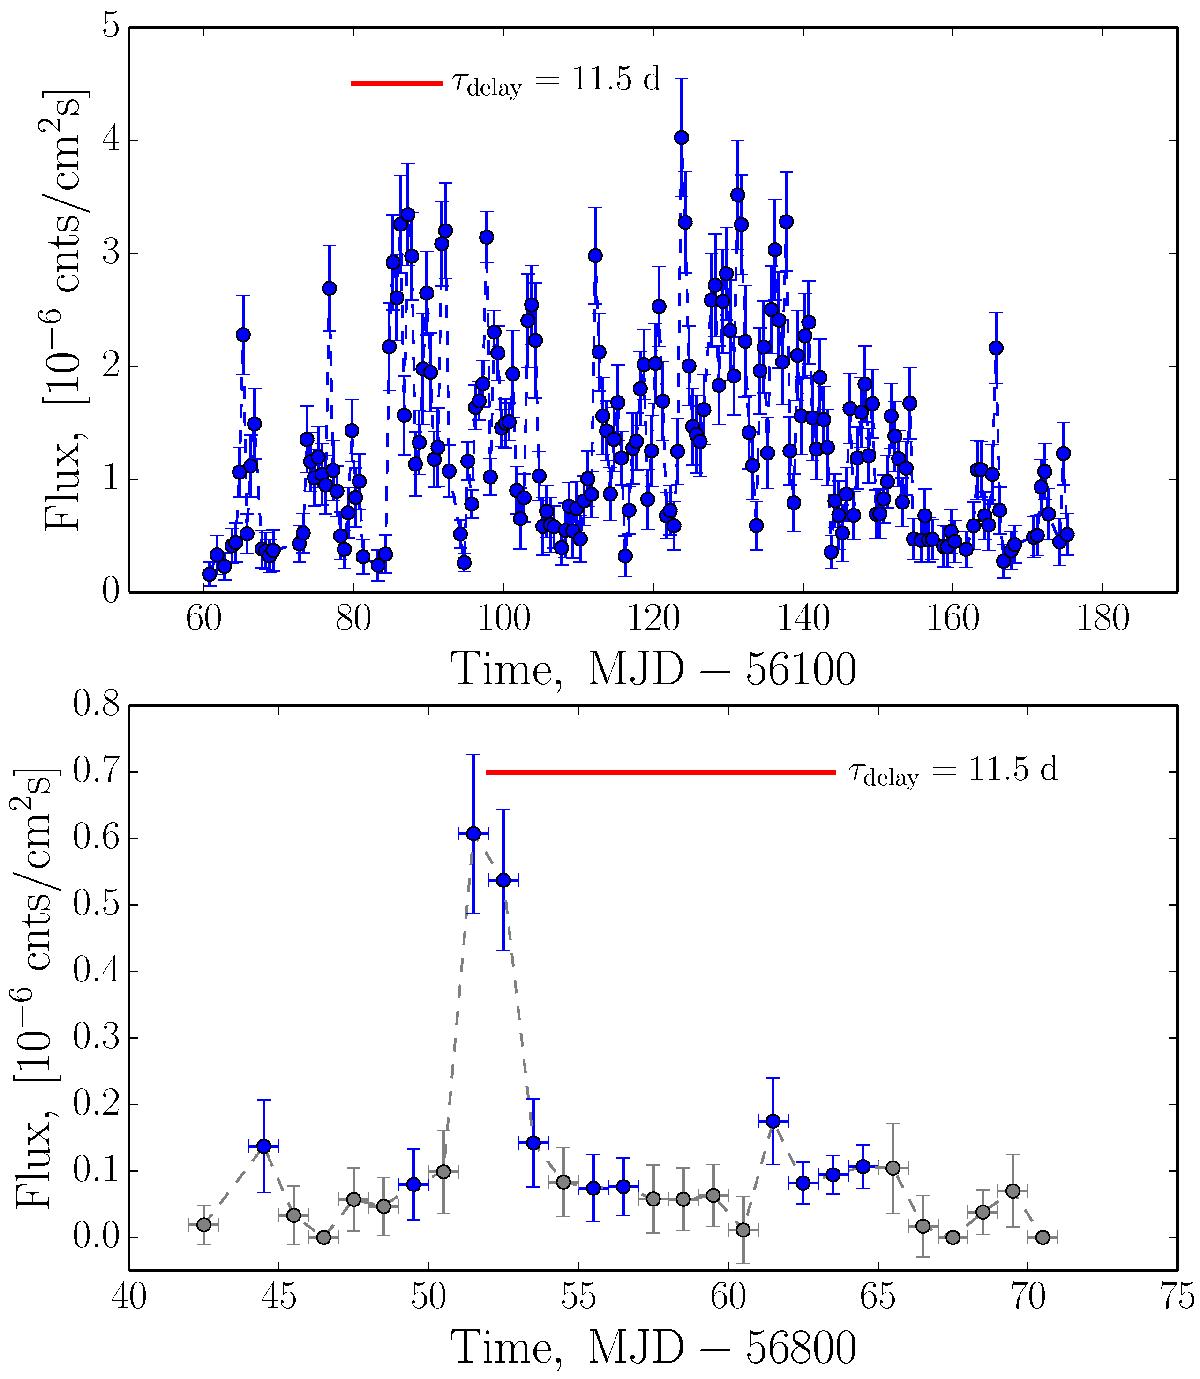
Light curves of the B0218+357 in 0.1−510 GeV band over its 2012 (top) and 2014 (bottom) flaring episodes. The bin size is 0.5 days for the 2012 and 1 day for 2014 light curve. Blue and grey data points indicate the significant and non-significant detections, respectively.
Current usage metrics show cumulative count of Article Views (full-text article views including HTML views, PDF and ePub downloads, according to the available data) and Abstracts Views on Vision4Press platform.
Data correspond to usage on the plateform after 2015. The current usage metrics is available 48-96 hours after online publication and is updated daily on week days.
Initial download of the metrics may take a while.