Fig. A.1
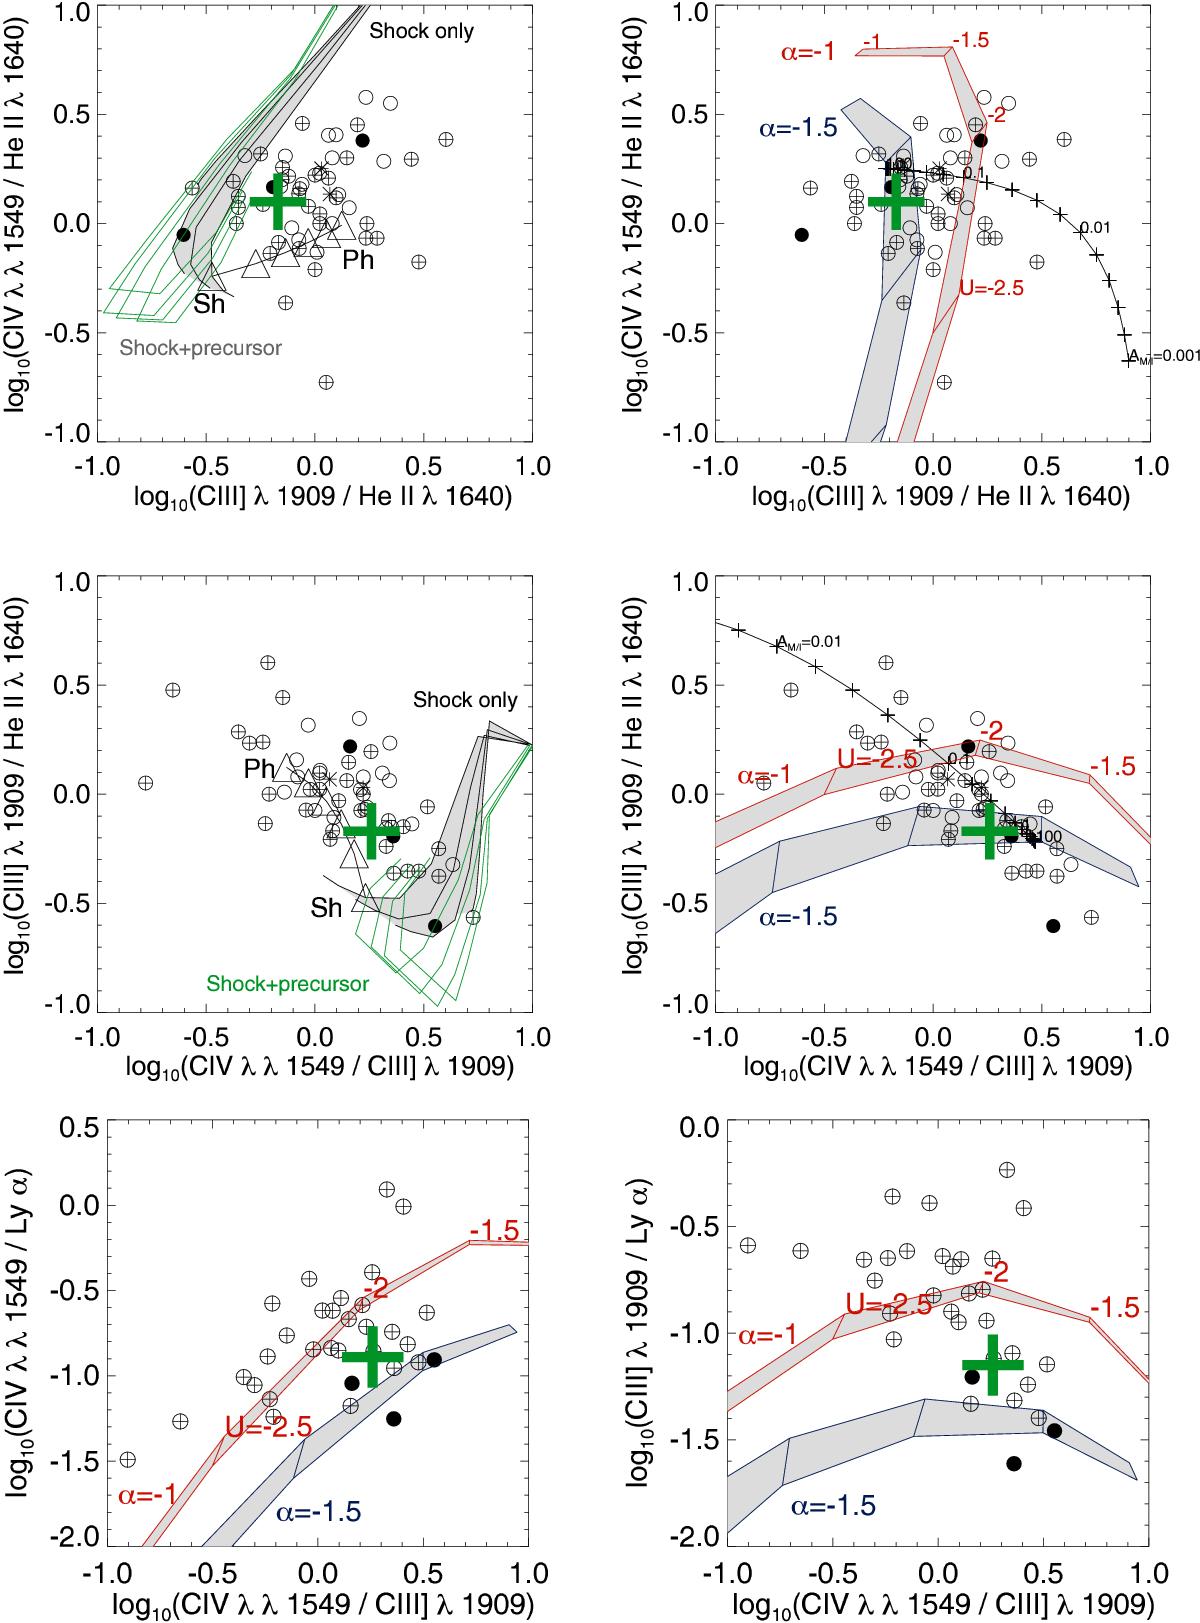
Line ratio diagnostic diagrams involving Lyα, CIV, HeII, CIII], and CII] (adapted from De Breuck et al. 2000, their Fig. 13). The thick green cross shows the flux line ratios observed for Yggdrasil, while the circles show other HzRGs from the literature. Also shown are photo-ionisation and shock models to illustrate that the observed line ratios in Yggdrasil are dominated by photo-ionisation with a contribution of up to ~30% by shocks (see De Breuck et al. 2000, for more details).
Current usage metrics show cumulative count of Article Views (full-text article views including HTML views, PDF and ePub downloads, according to the available data) and Abstracts Views on Vision4Press platform.
Data correspond to usage on the plateform after 2015. The current usage metrics is available 48-96 hours after online publication and is updated daily on week days.
Initial download of the metrics may take a while.